Thursday, May 28. The biggest exchange inflow XRP had seen all year landed quietly. No fanfare. Just 22.80 million tokens piling onto exchanges at what turned out to be the lowest price in 15 weeks.
Some retail traders sold. Then something shifted.
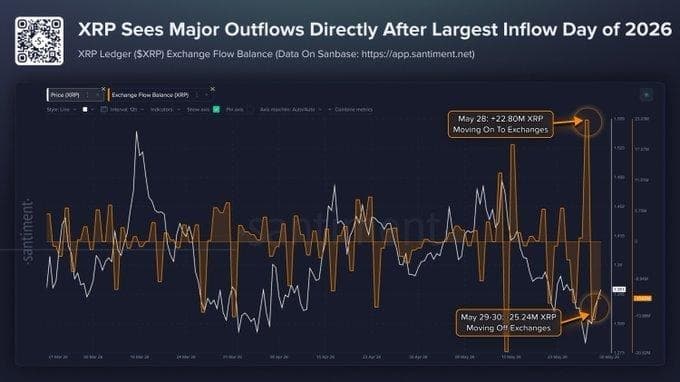
Source: Santiment — XRP Ledger Exchange Flow Balance, May 28-30, 2026. Data via app.santiment.net
According to Santiment’s exchange flow tracking data, the 22.80M XRP inflow on May 28 was the largest single-day exchange deposit recorded for XRP in all of 2026. That spike happened at the local price bottom. Within the next 48 hours, 25.24M XRP reversed direction and moved off exchanges entirely.
That is a net swing of over 48 million XRP changing direction in less than two days. Retail who sold near that low now sit on immediate losses since the token’s value climbed 5% from that capitulation point.
The Sell Pressure That Wasn’t
The May 28 inflow read to many as a warning sign. Large deposits onto exchanges typically signal incoming sell pressure. For Kenyan crypto traders and smaller XRP holders watching the chart, that kind of spike on a Friday often means weekend volatility ahead. What followed instead was a fast reversal.
As SantimentData posted on X, the coins that moved on at the local bottom kept moving. Most did not trade. They exited the order books and went back into private wallets between May 29 and May 30.
“The massive flow of coins moving on to exchanges occurred right at the local bottom for XRP’s price, leaving many retail traders who decided to sell off at the lowest price in 15 weeks… wishing they hadn’t,” SantimentData wrote on X. XRP’s trading value was up a modest 5% since that capitulation day, the post noted.
That 5% move is small in isolation. But it landed on top of an on-chain structure that multiple data sets say was already pointing toward a floor.
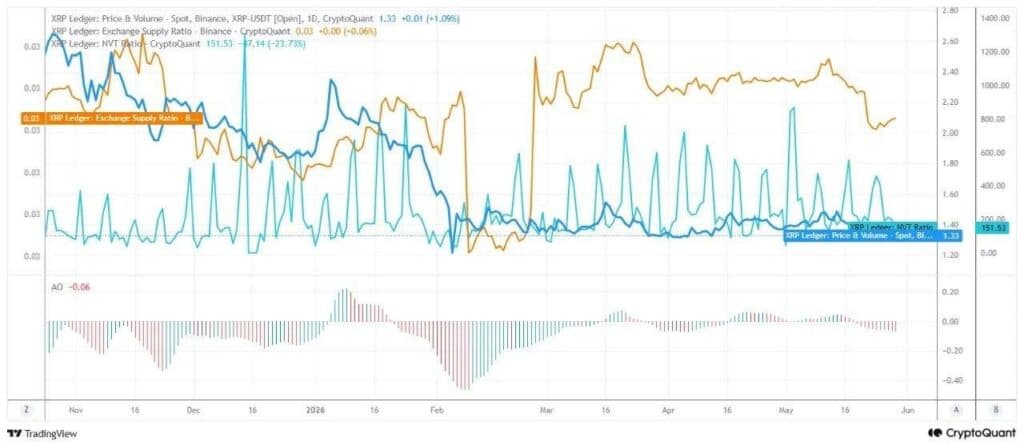
Source: CryptoQuant — XRP Ledger Price, Exchange Supply Ratio (Binance), NVT Ratio and Awesome Oscillator. Data as of late May 2026.
Four Signals. One Chart. One Direction.
A CryptoQuant analysis published this week broke down four metrics running in parallel: price, the Exchange Supply Ratio on Binance, the NVT Ratio, and the Awesome Oscillator. Together, they tell a story that the exchange flow data from Santiment reinforces.
Price has been consolidating near $1.33 after months of sharper swings. Not a breakdown. Not a breakout. A pause.
The Binance Exchange Supply Ratio peaked in March and April, then entered a clear downtrend through May. Fewer XRP tokens sitting on Binance ready to sell means less immediate pressure against any upward move. That drawdown in exchange-held supply is visible across both the CryptoQuant chart and the Santiment flow data, two independent data sources arriving at the same read.
The NVT Ratio, which compares network value to transaction volume, fell 23.73% to 151.53 per CryptoQuant’s own calculations. A declining NVT points to strong on-chain activity relative to price. In other words, the XRP network processed a significant volume of real transactions even while the price stayed compressed. CryptoQuant’s note on this: “A declining NVT is often viewed as a sign that an asset is trading at a relatively attractive valuation and is not excessively overvalued.”
Momentum Is Sitting on a Wire
The Awesome Oscillator reading, at negative 0.06, sits just below zero. Bulls do not have momentum. Neither do bears. CryptoQuant describes this as an “important equilibrium zone” at $1.33.
That equilibrium is exactly what makes the Santiment flow data from May 28 to 30 worth watching. Large inflows at a price bottom, followed immediately by a larger outflow, suggest the coins that entered exchanges at the lows were absorbed fast. Not panic. Accumulation.
CryptoQuant’s full analysis, available here, concludes that XRP “may have already completed, or is close to completing, its bottoming process.” The declining exchange supply and the lower NVT are the two pillars that note cites.
Neither metric guarantees what happens next. The Awesome Oscillator still reads negative. Any failure to hold the $1.33 support zone would reopen downside conversation quickly. If weekly volume does not confirm a directional move within the next few sessions, the equilibrium could resolve in either direction, CryptoQuant’s read on the Awesome Oscillator implies.
What Retail Got Wrong. Again.
The 15-week low was the moment retail reached for the sell button. The data from Santiment shows exactly when: May 28, the same session that printed 22.80M XRP in exchange inflows. That was also the session the bottom was printed.
This is not the first time that pattern has shown up. Earlier in 2026, similar inflow spikes preceded short-term price recoveries as the coins that hit exchanges were absorbed rather than sold at scale. Whether this May event follows that same script depends on whether the $1.33 consolidation zone holds and whether the outflow rate seen on May 29 and 30 continues.
Santiment’s full XRP exchange flow balance chart, updated daily, can be tracked at app.santiment.net. CryptoQuant’s bottoming analysis is accessible via their Quicktake section. Together, they give XRP holders the clearest on-chain picture of where coins are actually sitting ahead of the next directional move.