Something is breaking down inside XRP‘s market. The price is barely moving. But the data underneath it tells a very different story. A new report from CryptoQuant shows XRP’s NVT ratio has climbed 20.3% above its 3-month baseline while the asset consolidates near $1.33. At the same time, Binance spot activity has essentially frozen.
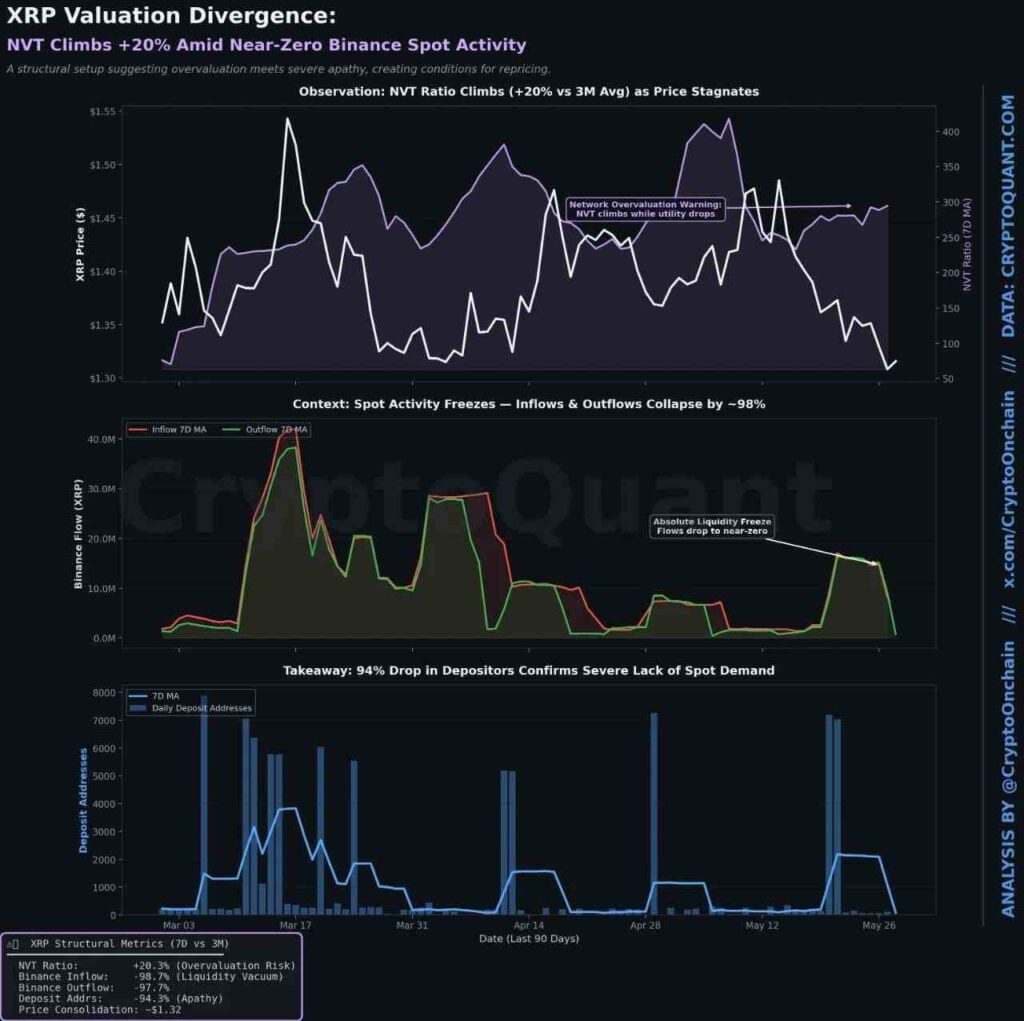
Source: CryptoQuant | @CryptoOnchain NVT ratio, Binance flow and deposit address data (90-day window, May 2026)
The Number That Should Worry Retail XRP Holders
The NVT ratio, which compares a network’s total market value against its on-chain transaction volume, has been climbing steadily for the past week. That 20.3% increase relative to the 3-month baseline is not noise. It is a structural divergence.
Put plainly: the network is being priced higher than the actual economic activity running through it can justify. That gap, when it widens without a catalyst to close it, has historically resolved in one direction.
Lower.
A retail XRP holder watching this setup needs to understand what that divergence means in practice. Valuation stretching ahead of real utility is the same setup that preceded the Q1 2026 correction. The numbers confirm it.
Binance Froze. Almost Completely.
The exchange data is where this gets harder to ignore. According to CryptoQuant’s on-chain tracking published May 29, Binance XRP inflows collapsed approximately 98.7% below their 3-month average. Outflows dropped 97.7% by the same measure.
That is not a slow market. That is a market that has stopped. Both sides of the trade, buyers depositing to buy and sellers depositing to sell, have walked away at the same time.
Active deposit addresses to Binance fell 94.3% from the 3-month baseline. The chart from @CryptoOnchain. whose data forms the basis of this analysis, shows that daily deposit addresses have flatlined across most of May. There were brief spikes around May 12 and May 26, but the broader trend has held near zero.
“XRP is displaying a growing divergence between its network valuation and actual fundamental utility,” CryptoQuant noted in the May 29 quicktake. The combination of rising NVT and collapsed exchange participation “creates conditions that historically preceded a market repricing.”
As @CryptoOnchain posted , the chart annotation is direct: “Absolute Liquidity Freeze. Flows drop to near-zero.” That label sits over the Binance inflow and outflow chart for the final weeks of May 2026.
When Both Signals Point the Same Direction
CoinDesk, Cointelegraph and Decrypt have covered XRP’s NVT story from the angle of whether the metric is bullish or bearish in isolation. What the CryptoQuant data surfaces this week is something they have not addressed: the simultaneous collapse of both the NVT baseline and the exchange participation rate.
One signal alone is ambiguous. A rising NVT with strong inflows could mean speculation is running hot but demand exists. A dead spot market with a stable NVT could mean the asset is just illiquid, not necessarily stretched.
This setup is neither. Both are moving together. Rising overvaluation warning meets a near-complete absence of organic buying. That combination is the structural setup CryptoQuant’s quicktake describes as preceding repricing in prior cycles.
Bitcoin open interest in XRP futures has stayed elevated even as spot activity collapsed, per CoinGlass data. That divergence between derivatives positioning and spot participation is an additional layer of risk the current price is sitting on top of.
What Would Change the Picture
The CryptoQuant report does not call a specific price target. But it does identify one clear signal to watch: a sustained return of Binance inflows. Without that, the current price consolidation near $1.33 lacks the organic demand needed to hold.
CryptoQuant analyst Ki Young Ju, CEO of CryptoQuant, said in a May 2026 statement that on-chain metrics showing a gap between market cap and transaction activity are “one of the cleaner early-warning signals available to retail investors who cannot access institutional order flow.”
The thesis fails if Binance inflows return sharply and on-chain transaction volume picks up in sync. A genuine demand catalyst, whether a regulatory development or a large institutional move into spot, could close the NVT divergence from the top rather than the bottom. That scenario cannot be ruled out but currently has no data support.
Until deposit addresses recover and inflows normalize, the structural metrics are pointing toward a lower liquidity zone test before any sustainable recovery.