All Articles
21 articles
 Market News
Peter Brandt's SOL $43 Target Triggers a Brutal Public Feud on X
Veteran trader Peter Brandt posted a weekly SOL chart showing a 14-week rectangle and a potential $43.70 downside target. What followed on X was not a debate about Solana. It was a fight about whether anyone with a chart should be trusted at all.
 Market News
NEAR Down 93% From ATH But Charts Show Accumulation Zone Traders Are Watching
NEAR Protocol sits 93% below its all-time high of $20, but technical chart structure on both weekly and daily timeframes points to a potential accumulation zone forming between $0.90 and $1.20, with analysts identifying key levels that could define whether a macro reversal is building or still ahead.
 Market News
SUI Breaks October Crash Resistance With $2 Target Now in Sight
SUI broke above bearish resistance from the October 10 crash, clearing a key structural ceiling with limited supply overhead and a $2 target in view.
 XRP News
XRP Could Drop to $0.90 Before a Historic Rally to $13
Two chart analysts now agree XRP could drop to $0.90 before a major bull run toward $13, based on a multi-year triangle pattern forming since 2017.
 XRP News
XRP Price Stuck in Chop: What the EMA Chart Is Really Saying
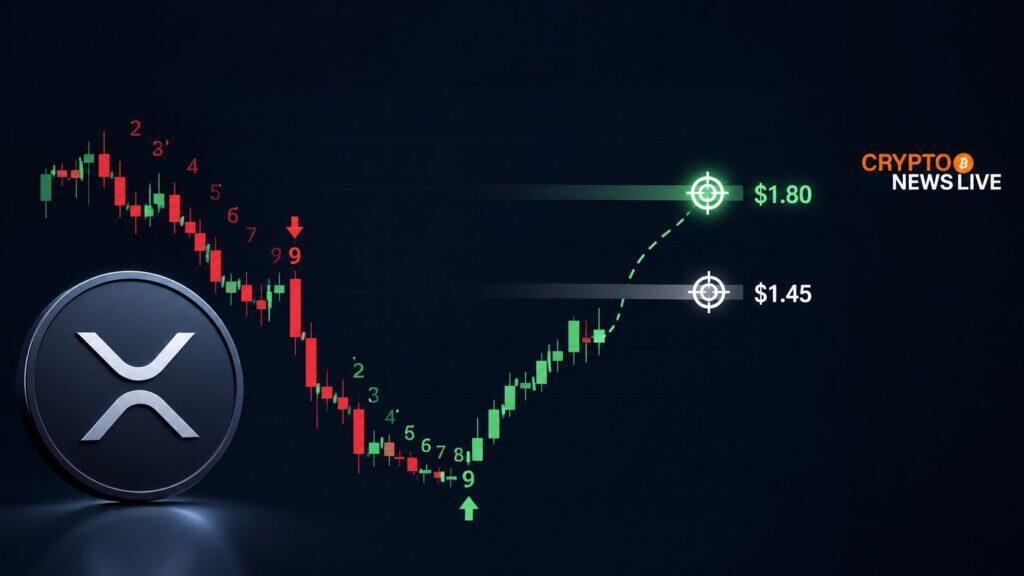
XRP consolidates under twin EMA resistance at $1.50. A break higher targets $1.80-$2, but $1.38 is the line that matters most right now
 XRP News
XRP Hits 11 Weeks Rangebound as Break Looms
XRP has held between $1.30 and $1.50 for 11 straight weeks. Chart analysts now flag a megaphone pattern and a key trend line that could decide the next direction.
 ETHEREUM NEWS
Ethereum Price Gap at $2,634 Is the Altcoin Market's Trigger
ETH is trading inside a rising channel after dropping from $4,800 to $1,765. The next move above $3,056 on the daily chart could unlock the broader altcoin market surge analysts are watching for.
 Bitcoin News
Bitcoin April Price Outlook Turns Bearish After March Green Close
Bitcoin ended March in the green, snapping a streak of red monthly candles. That sounds like progress. The data underneath that close tells a different story. CryptoPatel, writing on X, pointed out that the green close does not flip the macro trend. The monthly structure still favors downside. One candle does not reverse the broader
 ETHEREUM NEWS
Ethereum Retests Key Zone That Sparked Every Bull Run
Ethereum is sitting on a trendline that has held since 2017. Two technical analysts have now flagged specific support levels — and the targets being floated are not small numbers.
