SOL was trading around $86 on the weekly chart when Peter Brandt posted something that lit the crypto corner of X on fire. It was not a prediction. That distinction would matter very shortly.
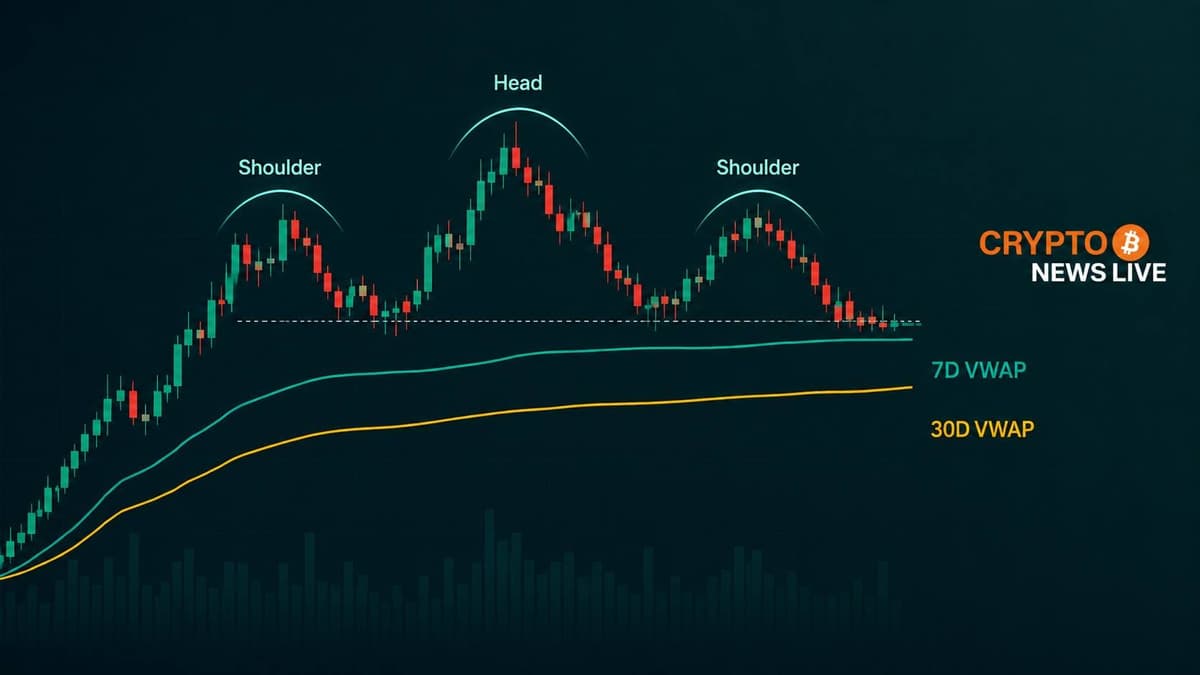
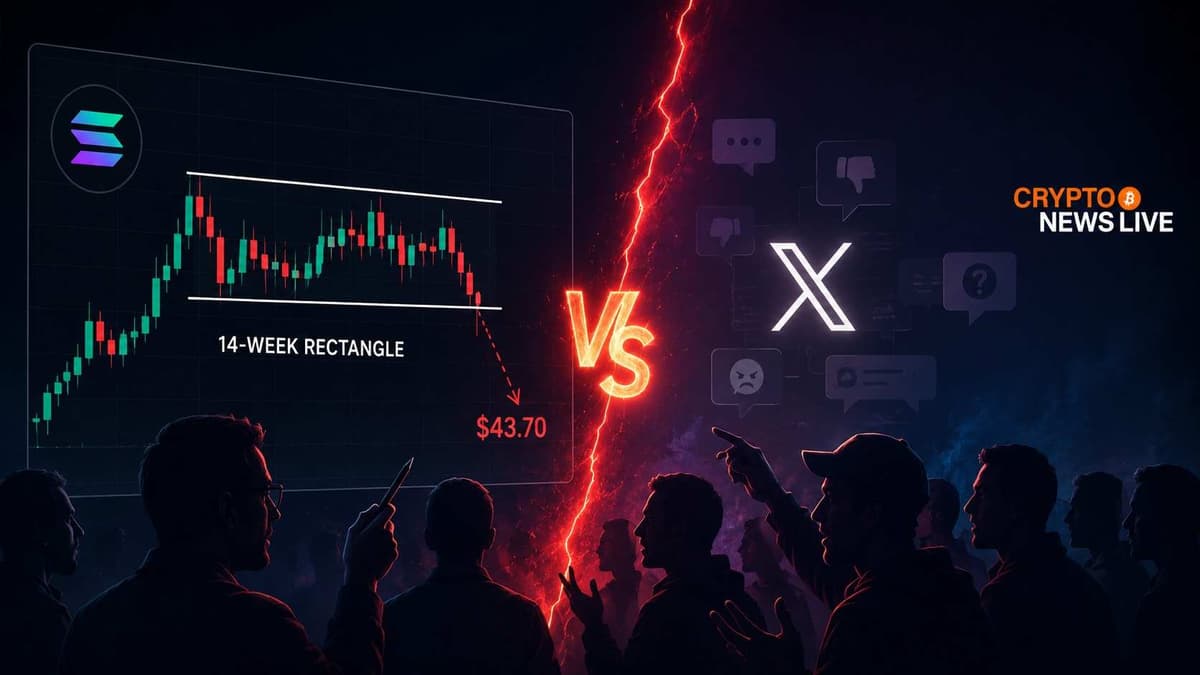
Brandt, founder of the Factor Report and a veteran futures trader who has been active in markets since the 1970s, shared a weekly chart of Solana on May 16 noting that SOL had formed a 14-week rectangle. The chart pointed toward a possible downside breakout target of $43.70, derived from the measured move of a larger head-and-shoulders pattern visible on the weekly timeframe.
When a Chart Reading Becomes a Courtroom
He was careful about the framing.
“The Factor Report does NOT make predictions. We present possibilities. The weekly chart of $SOL now presents a 14-week rectangle. If it is a continuation rectangle with downside BO, then the 43.70 target from the massive H&S top will be confirmed,” as Peter Brandt posted on X.
That qualifier — “if” — did not survive the reply section intact.
Ahmad Ibrar, an X-based crypto commentator, pushed back almost immediately. His argument was not really about Solana. It was about the culture around technical analysis itself and the gap between conditional language and how that language gets received once it starts circulating.
“I hate when people predict targets like they’re guaranteed. 43.70 is just a probability not a confirmed target. There’s literally no confirmation on the chart. People draw a few random lines, write some ABC pattern, and start making bold predictions,” as Ahmad Ibrar posted on X.
Ibrar also noted that few voices were calling for a correction when SOL was trading above $220. Now, he wrote, everyone has suddenly become an analyst.
The Part Nobody Expected
Brandt did not let it go.
“In fact I was trading futures contacts when you were not even an imagination in your mom’s belly. Grow a pair,” as Peter Brandt posted on X in response.
That reply cut through the usual chart discourse. Ibrar returned with a response that framed Brandt’s decades in markets not as authority but as stubbornness, writing that 51 years of trading had apparently not produced patience or humility.
“Sorry sir I didn’t mean to hurt the fragile ego of old 1975 wizard who’s been trading for 51 years but still hasn’t learned patience humility or anything at all. The market clearly failed to teach a stubborn fool like you,” as Ahmad Ibrar posted on X.
He added that he would not be sharing charts going forward, claiming 80% of Brandt’s predictions were wrong anyway.
What the Chart Actually Says
The underlying technical picture is worth separating from the noise.
Brandt’s weekly chart, produced via TradingView, shows SOL forming what he describes as a 14-week rectangle sitting below a much larger head-and-shoulders structure. The left shoulder, head, and right shoulder are visible across the 2024-to-2025 price cycle. The rectangle pattern sits at the base, near current trading levels around the mid-80s.
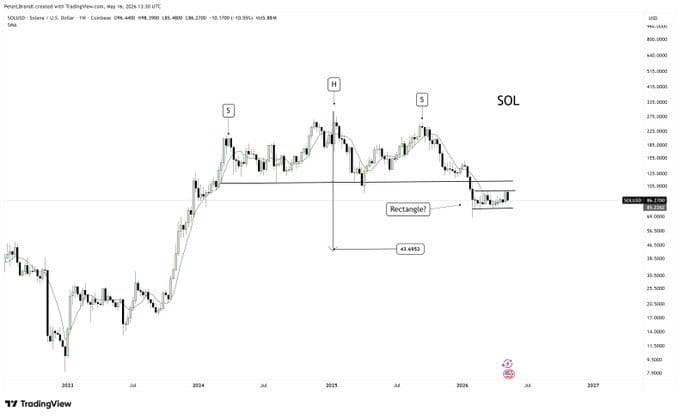
The $43.70 target is a measured move derived from the depth of that H&S pattern. It is not a trade call. It is the level the pattern would project to if a confirmed downside breakout occurs. No breakout has been confirmed as of publication.
On-chain and ETF data adds some weight to the bearish structural view. Monthly Solana ETF inflows have declined for six consecutive months, falling from $419.38 million in November 2025 to $39.93 million in April 2026, per SoSoValue data. The weakening institutional flow has not broken the price below key support yet, but it removes one of the more reliable cushions. A retail SOL holder watching the weekly chart for directional clarity has no confirmed signal either way right now.
Probability Is Not a Price Target
The exchange between Brandt and Ibrar surfaces something that matters beyond the specific argument.
Technical analysis operates in probabilities. The $43.70 level Brandt cited is what the pattern implies mathematically if it resolves bearishly. Ibrar’s criticism was that this distinction collapses the moment the number circulates. People read the chart, see $43.70, and strip out every conditional qualifier Brandt attached.
Brandt’s response style, whatever one thinks of it, is consistent with how he has always operated on X. He publishes chart reads under the Factor Report banner, states conditions explicitly, and does not soften his views in reply sections. Whether that approach produces accurate calls is a separate question. Ibrar called his win rate into question directly.
Neither side provided verifiable performance data in the thread.
What remains from the exchange is the chart itself. SOL is sitting inside a rectangle that has not resolved. The $43.70 level exists as a conditional target. And the weekly volume, which has been declining, has not yet confirmed a breakdown. If volume picks up to the downside and the rectangle support fails, that number becomes relevant. If SOL reclaims the $97.64 level visible on the weekly chart, the pattern is structurally invalidated, as noted by analysis from BeInCrypto.
The argument on X will not resolve either outcome. But it did make the chart more widely viewed than it would have been otherwise.
Disclaimer: This article is for informational purposes only and does not constitute financial advice or investment guidance. Cryptocurrency markets are highly volatile. Price analysis and chart patterns discussed here represent possibilities, not confirmed outcomes. Always conduct your own research before making any investment decisions.