FET is sitting just above a narrow band near $0.21 on the 4-hour chart against the US dollar on Binance. The price has pulled back from a recent short-term high, and on-chain structure from the 2026 low has not produced a single impulsive move. That absence matters far more than any price level in isolation.
Most coverage of Fetch.AI right now leans on long-range forecast models or broad AI sector momentum. The shorter-term wave structure tells a different story. For a retail FET holder monitoring the $0.20 zone from a volatile currency environment, where getting the direction wrong carries real cost, the structure is the part worth understanding first.
The 3-Wave Problem From the 2026 Low
As More Crypto Online posted on X, the entire advance from the 2026 low consists of only three waves. Three waves, not five. That distinction is structural. A five-wave advance signals the start of a new directional trend. A three-wave advance is a corrective move, a bounce inside a larger decline, not a reversal of it.
The local downtrend stays intact until price produces a convincing impulsive reaction to the upside. So far, that reaction has not appeared. The market bounced, but it bounced in the shape of a correction, not in the shape of something new beginning.
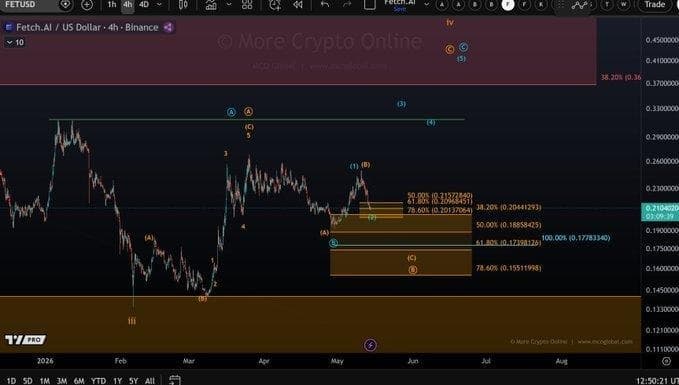
FET/USD 4-hour chart showing corrective wave structure from the 2026 low. Source: More Crypto Online / TradingView
Two Scenarios, One Deciding Level
More Crypto Online outlined two paths forward. The blue scenario, the more direct bullish path, requires the micro support zone between $0.201 and $0.222 to hold firm and produce a sharp move higher from that zone. That scenario is described as speculative. The word choice is deliberate.
The orange scenario carries more structural weight at this point. It has the current pullback extending lower toward the 100% extension of the A-wave, which lands at $0.177. That level is where the C-wave of a larger corrective sequence would ideally complete. Bitcoin open interest climbed 12% to $18.4 billion on May 13, per Coinglass data, a sign that broader crypto risk appetite is shifting, but FET’s internal wave count has not confirmed any local bottom yet.
The $0.177 zone is not a worst-case number pulled from nowhere. It is the measured 100% extension of the prior A-wave decline, applied to the current C-wave. Elliott Wave methodology uses these extensions precisely because they repeat with enough frequency to be worth tracking.
What Needs to Happen Before the Bearish Case Is Off the Table
“Key resistance to the upside, 24.8 cents. We need a break above that level to signal that a low is in.”, More Crypto Online, as posted on X
The resistance level sitting above current price is $0.248. A close above that level is the minimum required to signal that a local low is in. Until that happens, any bounce from $0.201 or lower is still operating inside the corrective structure, not outside it. More Crypto Online noted on X that without a five-wave move up, especially from the 2026 low, the probability stays elevated that price is in a larger B-wave pullback.
Tracking the 4-hour order book through the $0.20 zone over recent sessions shows no accumulation spike that would suggest a strong defense of that level. The price is holding, but it is holding passively rather than with any visible demand surge underneath it.
The Risk That Changes the Picture
The blue scenario does not disappear simply because it is speculative. If the $0.201 floor holds and FET produces a sharp, high-volume move through $0.222 and toward $0.248 in a single session, the wave count shifts. That kind of move would be the impulsive reaction the structure currently lacks. Without it, the orange path toward $0.177 stays the higher-probability outcome based on current wave form alone.
The setup could also shift if broader crypto conditions change fast. A sharp Bitcoin move higher could pull FET above $0.248 by momentum alone, regardless of its internal structure. That is the external factor worth watching alongside the levels.
Key support levels to watch: $0.201 and $0.177. Key resistance: $0.248. The structure remains corrective until price proves otherwise.