$SUI spiked to $1.4243 on May 10. Then it gave most of it back.
The pullback returned price almost exactly to where the rally started, right into the $1.05 to $1.07 demand zone traders had been watching for weeks before the breakout even happened.
Source:bitgu_ru
The Zone That Launched the Last Leg
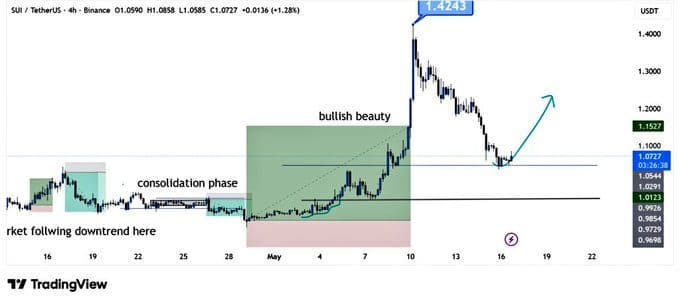
The 4-hour Binance chart tells a story the weekly headlines missed. Price spent weeks inside a tight consolidation band before pushing into what the chart labels a “bullish beauty” phase, running from below $1.05 all the way to the $1.4243 peak. Now it is back. Right at the floor.
“I am watching $SUI closely here because price is holding a strong support zone around $1.05 – $1.07. If buyers regain momentum from this area, SUI could push back toward the $1.20 level again.”
That $1.20 target is not arbitrary. It sat as the midpoint resistance during the rally phase. A clean reclaim of it from current levels would confirm the demand zone absorbed the selling, not just slowed it temporarily.
The 4H chart also shows a prior “consolidation phase” in the green zone well below $1.05, lasting several weeks before the breakout triggered. If the structure repeats, the current pullback into support could be setting up the same pattern again.
BTC Is the Variable Nobody Is Ignoring
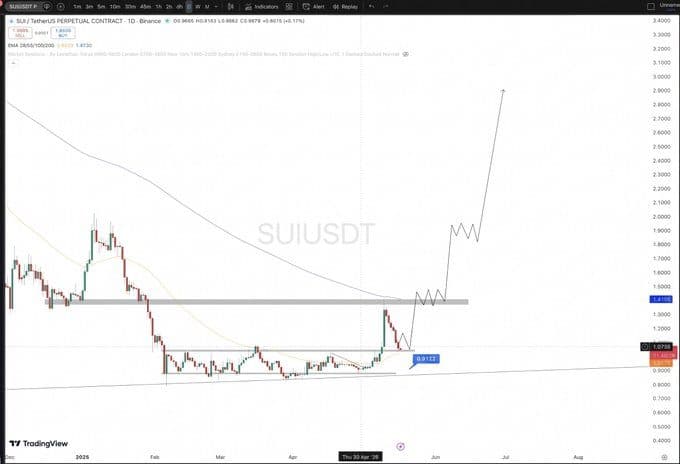
The daily chart from the Community_Sui account on X adds a layer the 4H view does not cover. On the daily timeframe, the SUIUSDT perpetual contract shows price pulling back from the $1.4243 peak with a projected recovery wave reaching toward the $2.50 to $3.00 area through mid-year.
That long-term projection has a condition attached.
As Community_Sui posted on X:
“$SUI CHART | 1D UPDATE — @SuiNetwork is at a critical juncture, and the price will largely depend on the overall market. We’re watching the $1.0 to $1.1 support zone closely, as losing this range could trigger a significant decline, especially with $BTC likely to drop toward the $74K zone. A fall to the $0.90 to $0.92 range is possible if the market continues to correct, but in the long term, it will soon reach the $1.4 zone.”
Source: Community_Sui
That is the clearest risk framing on SUI right now. The $0.90 to $0.92 zone is not a worst-case scenario pulled from thin air. It is the first major structural floor below the current demand band, and BTC correlation is the direct mechanism that could push price there.
What the Weekly Structure Actually Shows
The daily chart from Community_Sui is harder to read without context. It shows SUI trading near the 0.8122 level before the current recovery leg began, with the projected path climbing above $1.40 and continuing toward the $2.00 to $3.00 area. That chart was drawn before the May 10 spike, which means the spike itself matched the first leg of that projection almost exactly.
The remaining question is whether the pullback to $1.05 is the base of leg two or the start of something more damaging.
SUI open interest climbed above $708 million on May 10 per CoinGlass data, as 24-hour futures volume crossed $2.5 billion. Both numbers pulled back alongside price. SUI then dropped roughly 10% on May 15, continuing a five-day downtrend as futures open interest fell 10.5% and $7.2 million in liquidations hit mostly long positions, per CoinJournal data.
That is the bear case active right now. Live flow, not theory.
One Level. Two Very Different Outcomes
A SUI spot holder watching this has one clean decision point. The $1.05 to $1.07 zone either holds with volume returning, or it does not.
If buyers defend it, both the 4H structure and the daily chart point the recovery toward $1.20 first, $1.40 second, matching the long-term projection Community_Sui mapped before the spike ever happened.
If they do not, the analysis puts the next real floor at $0.90 to $0.92. No intermediate support of consequence sits between those two outcomes.
Nothing in between is especially useful to watch.