Ethereum’s weekly chart has closed a fresh TD Sequential sell signal. The same indicator that correctly called an 87% rally in April 2025 and a 134% surge in June 2025 is now pointing down. For a retail ETH holder sitting on a position bought anywhere above $2,000, this is not something to scroll past.
The signal comes from @alicharts, the widely followed technical analyst who tracks ETH structure on multiple timeframes. His TD Sequential has a documented track record on the ETH weekly that few indicators can match.
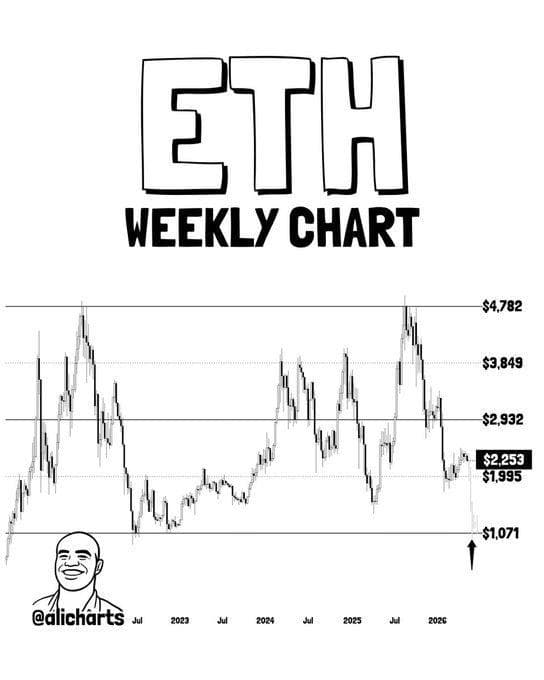
Chart: ETH Weekly — @alicharts via X
Three Signals, Three Outcomes — and Now a Fourth
The indicator’s recent history on the weekly timeframe is hard to dismiss. As Ali Charts posted on X, the April 14, 2025 buy signal produced an 87% rally. The June 16, 2025 buy signal ignited a 134% surge. The August 25, 2025 sell signal accurately timed a 63% correction.
> “New sell signal emerges for Ethereum! The TD Sequential indicator has been incredibly precise at anticipating $ETH trends over the past year. Every signal it has flashed on the weekly timeframe has been validated by significant price action.”
— Ali Charts (@alicharts) on X
That August correction is worth pausing on. ETH dropped 63% from a local high before the market found a floor. The signal that just closed on the weekly is the same setup, same timeframe. Three downside targets are now on the table.
Ali Charts puts short-term risk at $1,900, mid-term at $1,565, and long-term at $1,090. That last figure sits almost exactly at the channel bottom visible on the weekly chart he shared, where ETH has found structural support going back multiple years.
The $1,071 Level Is Not Just a Number
What most coverage of this signal misses is what happens at $1,071. Ali Charts, 17 hours after posting the sell signal, returned to X with a different framing entirely.
> “$1,071, at the bottom of the channel, looks like a strong area to buy Ethereum $ETH.”
— Ali Charts (@alicharts) on X
Source: https://x.com/alicharts/status/2055181636640141740
That is a significant qualifier. The sell signal is not a call to panic exit. It is a map of the corrective path, and the map has a destination where accumulation becomes the more logical posture. A longer-term ETH holder watching this play out has two separate decisions to manage, not one.
On-chain data from Etherscan and weekly candle tracking as of May 15, 2026 shows ETH holding in the $2,253 range, with the weekly structure already rolling lower inside the channel. The gap between current price and the $1,071 floor is just over 50%. That is not a small move, but the August 2025 correction covered 63%. The precedent is there.
Where the Thesis Breaks Down
The TD Sequential is a probabilistic tool, not a guarantee. If weekly volume picks up sharply before the $1,900 level is tested and ETH reclaims the $2,932 zone with a confirmed weekly close, the sell signal structure would weaken. Ali Charts himself acknowledges the signal points to a corrective phase, not a certainty of reaching the deeper targets.
The three prior weekly signals all validated, but past performance on an indicator is not a guaranteed future outcome. ETH has also seen structural support build at the $1,995 level visible on the weekly, which could absorb selling pressure before the mid-term $1,565 target comes into play.
What makes this cycle read differently from earlier TD sell signals is the timeframe convergence. The weekly sell signal is now live while shorter timeframes remain under pressure. That alignment tends to produce more sustained corrective moves than single-timeframe signals.
Disclaimer: This article is for informational purposes only and does not constitute financial or investment advice. Cryptocurrency investments carry significant risk. Always conduct your own research before making any financial decision.