
Ethereum exchange supply on Binance just touched its highest point since February. That number alone would draw attention.
But the whale count data running underneath it tells a different story altogether. Sixty large addresses are gone. The floor is $2,000.
According to CryptoQuant data, the Ethereum Exchange Supply Ratio (ESR) on Binance rose to approximately 0.0326 in May. That coincided with ETH trading near $2,370 at its recent local peak before pulling back toward $2,128.
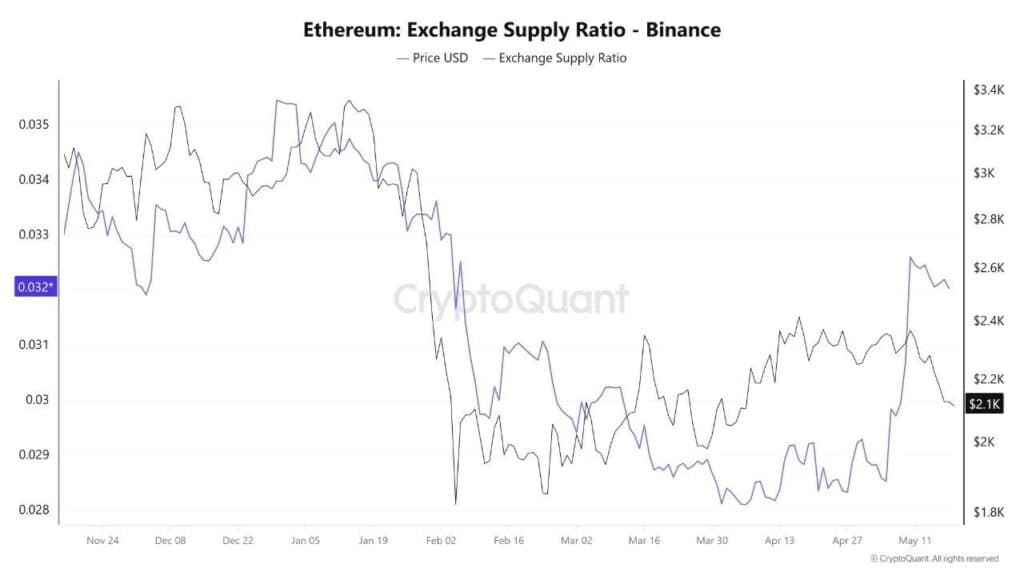
Ethereum Exchange Supply Ratio on Binance — Source: CryptoQuant
The ratio has since pulled back to around 0.0320. Still elevated. Still sitting at levels the market has not seen since early February.
The Quiet Months That Came Before
Between March and April, the ESR stayed below 0.029. Price action during that stretch was flat, short-term trading volume was low, and the ratio kept declining. Conditions looked stable.
Then May hit. Liquidity returned. Volatility followed.
CryptoQuant notes the rebound in the ESR reflects increased investor and trader activity returning to Binance, alongside rising volatility. The metric measures how much ETH supply sits on the exchange relative to circulating supply. A higher ratio means more assets available for immediate trading. That does not guarantee selling. But it raises the odds of sharper price swings if sentiment shifts.
What changed was not just the ratio. The big addresses started moving.
Sixty Addresses. Two Months. All Gone.
Glassnode data tracked by crypto analyst Ali Charts shows that roughly 60 whale addresses each holding at least 10,000 ETH have completely emptied or consolidated their balances since mid-March. That is a significant volume of multi-million dollar positions leaving the network inside a two-month window.
“Ethereum whales appear to be exiting the network. Over the past two months, approximately 60 whale addresses holding 10,000 $ETH or more have completely emptied or consolidated their balances.”
As Ali Charts (@alicharts) posted on X, when entities carrying positions of this size exit in such a short window, it typically reflects institutional profit-taking and asset relocation rather than routine portfolio shuffling.
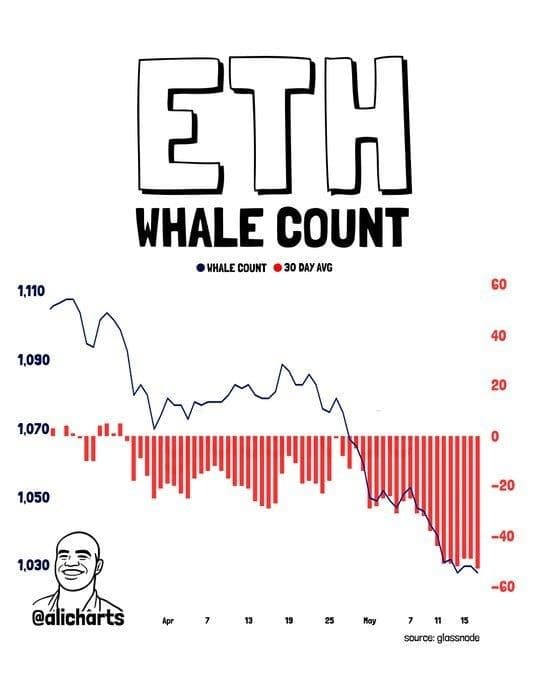
ETH Whale Count decline tracked via Glassnode — Source: @alicharts on X
Ali Charts described it as large players using recent liquidity to reduce risk exposure. The whale count chart from Glassnode shows the 30-day average turning sharply negative from early May, with the count dropping toward the 1,030 range from above 1,110 in April.
That is not noise. That is a structural shift in who holds ETH and how much.
Two Signals Running in the Same Direction
The convergence here is the part most coverage has not combined into one frame. Exchange supply is rising. Large addresses are exiting. Both signals point toward a market where more ETH is now accessible for trading on Binance at the same time that the largest long-term holders are pulling back.
For a retail ETH holder sitting just above $2,100, that combination deserves careful attention. More available supply plus reduced whale conviction is not a setup that historically supports sharp price recovery without new catalysts.
On-chain data from CryptoQuant at the time of publication shows the ESR holding near 0.0320 after pulling back from the May peak of 0.0326. The ratio spent the previous six weeks trading in a range between 0.028 and 0.030 before the May spike. The breakout above that range is the first since the February highs.
February was not a great month for ETH price. Worth noting.
The $2,000 Floor Ali Charts Is Watching
Ali Charts flagged the $2,000 psychological level as the key support zone to monitor in the near term. With whale count declining and exchange supply elevated, the analyst described the path of least resistance as pointing downward.
“The data indicates the path of least resistance remains down in the immediate future. I am watching the $2,000 psychological floor with extreme caution.”
That assessment from Ali Charts (@alicharts) on X aligns with the on-chain picture. Sixty addresses emptied in two months. Exchange supply spiked. ETH sits at $2,100.
The picture could shift. CryptoQuant notes that rising exchange supply does not guarantee an immediate sell-off. If buying demand at the $2,000 floor proves deep enough to absorb available supply, or if broader market conditions shift macro sentiment, the elevated ESR reading could resolve upward rather than down. The data points to risk. It does not confirm direction.
What the data does confirm is that two separate on-chain metrics are now running in the same direction at the same time. The retail ETH holder watching the $2,000 level does not need a prediction. They need the numbers. The numbers are here.