DOGE is not running yet. It is setting up, and the difference matters.
Dogecoin has been trading inside a narrow band above $0.1090 after weeks of compressing price action that followed a documented liquidity sweep earlier this year. The daily chart tells the full story in a way most coverage skips.
The Sweep Nobody Talked About
The TradingView daily chart for DOGE/USDT on Binance shows a clear sequence. Price printed a sharp liquidity sweep in February 2026, pulling below range lows before recovering. That move flushed out positions held since November 2025 and reset the structure.
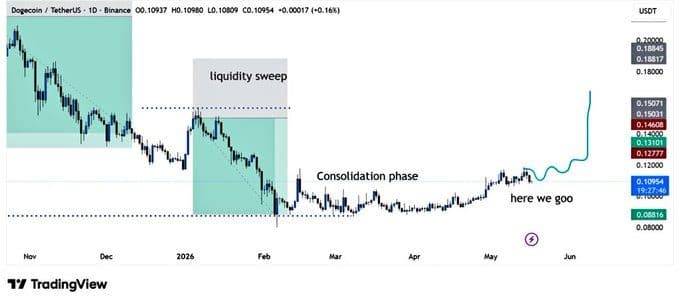
DOGE/USDT 1D Binance TradingView chart showing liquidity sweep, consolidation phase, and current bounce labeled “here we goo”
What followed was a prolonged consolidation phase, visible on the chart from March through April. Price coiled between roughly $0.088 and $0.110, printing a series of tightening candles. The recent push above $0.1090 is the first meaningful break out of that range.
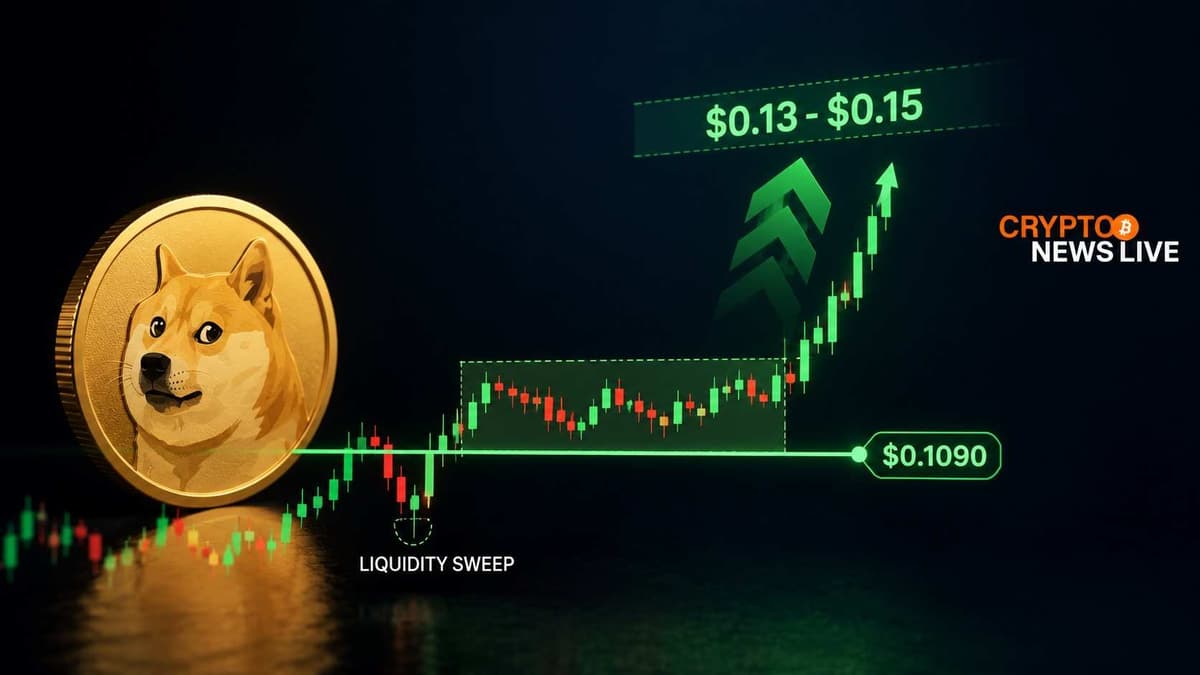
As bitgu_ru posted on X, the chart shows a long consolidation period after the major liquidity sweep and downtrend. The note flags $0.13 to $0.15 as the potential breakout destination if current momentum holds.
“if momentum continues from here, we could see a strong breakout toward the $0.13 – $0.15 range”
That range lines up with the resistance cluster visible near the top of the TradingView chart, which marks levels around $0.13101 and $0.15031.
Buyers Are Still There, But Confirmation Is Pending
The 1-hour structure is doing most of the work right now. According to shaunanalysis on X, price formed a clean recovery structure after rejecting local highs, with buyers slowly reclaiming momentum above $0.1100.
“weak hands are getting shaken out before the real move… Current bounce shows demand still active, but confirmation only comes if $DOGE holds this zone and pushes through nearby resistance.”
Support is holding between $0.1090 and $0.1100. Short-term resistance sits near $0.1135. A higher low formation is visible on the 1H chart, which shaunanalysis flags as the key structure to watch.
The posted levels are specific. Entry zone sits between $0.1110 and $0.1118. Take profit targets are $0.1138, $0.1160, and $0.1195. The stop loss is set at $0.1084, just below the support range. For a retail DOGE holder trying to time a low-risk entry, these are the numbers to watch against current price.
Not a Chase, A Wait
Volume has not confirmed the move yet. Shaunanalysis notes that if volume picks up near the breakout zone, momentum can accelerate fast. That is the condition. Without it, the setup does not trigger.
The chart annotation on the TradingView daily says “here we goo” at the current price level, pointing to the first real directional push since the consolidation phase ended. But both sources agree: the move is not chasing.
DOGE, bitgu_ru noted on X, tends to move hardest when the market gets bored with it.
The weekly volume across May has not shown the kind of spike that typically precedes a confirmed breakout on the daily timeframe. That is the risk condition sitting on top of this setup. A failure to hold above $0.1090 on a daily close would pull price back into the prior consolidation range, with $0.088 acting as the next meaningful floor below.