Something unusual showed up on the ZEC price analysis charts this week. The kind of structure that does not appear often, and when it does, it tends to matter.
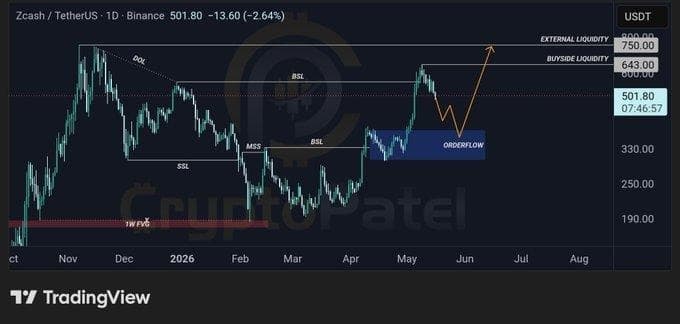
Zcash has been trading near $501 on the Binance ZECUSDT daily pair. Down 2.64% in the session at time of writing. But the short-term dip is not the story. The structure forming underneath it is.
Chart: ZEC/USDT Daily — Binance via TradingView (CryptoPatel)
The Chart No One Talked About
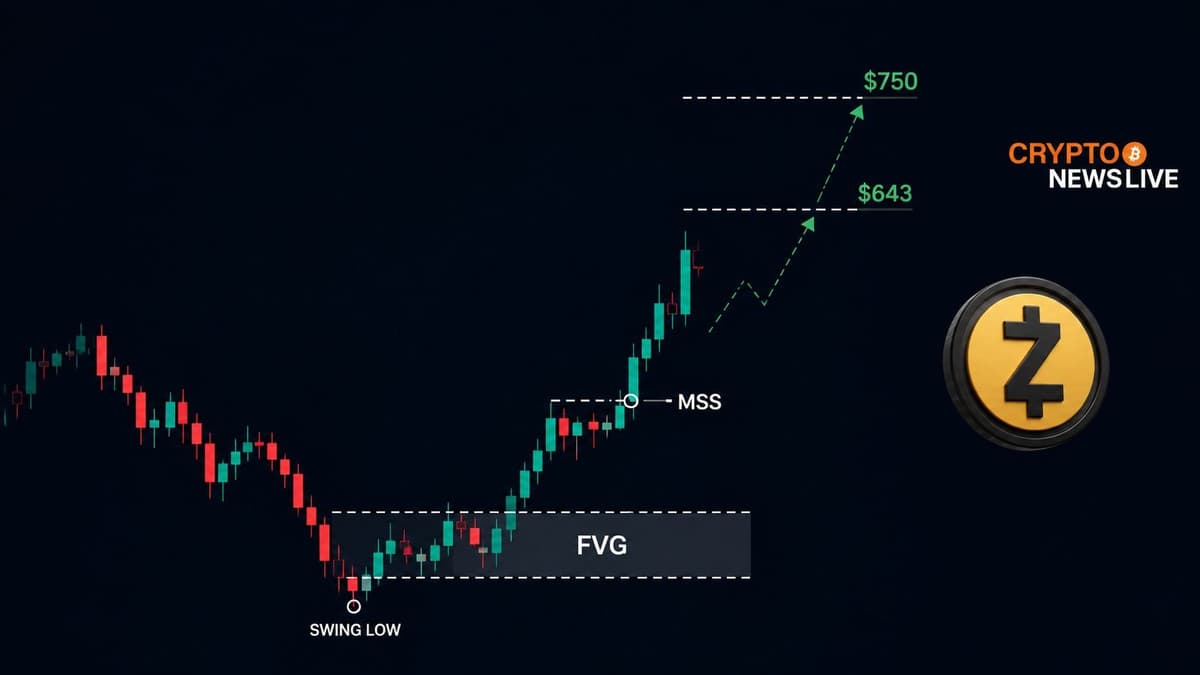
The weekly fair value gap sitting near $190 was the origin point. Price displaced strongly out of that zone, a move that crypto strategist CryptoPatel flagged on X as a textbook bullish displacement from a 1-week FVG.
After that displacement, a market structure shift confirmed. The MSS is what traders using Smart Money Concepts call a point where lower highs stop printing and price starts making higher highs for the first time. That flipped the short-term bias decisively.
As CryptoPatel posted on X: “ZEC has formed a strong bullish structure after displacement from a weekly fair value gap, with MSS confirming reversal and price retracing into an orderflow zone for continuation toward upside liquidity.”
That retracement is happening now. Price has pulled back from its recent highs and is sitting inside what the analysis identifies as a discount orderflow zone. The highlighted blue rectangle on the chart marks this area. It is where the smart money thesis says continuation entries form.
What the Liquidity Map Actually Says
Two targets sit above current price. The first is $643, which corresponds to buy-side liquidity accumulated below the BSL level visible on the chart. The second is $750, labeled as external liquidity at the top of the chart’s projected range.
Those are not random numbers. Buyside liquidity in SMC analysis refers to clusters of stop orders resting above swing highs. Price tends to seek those levels as it moves through structural ranges, because liquidity is the fuel.
CoinLore technical data as of mid-May 2026 shows 14 of 23 indicators reading bullish for ZEC, with all five daily exponential moving averages stacked below current price as dynamic support. The nearest resistance sits at $636.55, about 11.8% above the current $501 level, per CoinLore’s live indicator feed.
The Level That Breaks the Setup
Invalidation sits at $294. A daily close below that level, per CryptoPatel’s analysis, would break the bullish thesis entirely. That is not just a number pulled from thin air. The $300 area has acted as a major structural pivot going back months, with strong bounces recorded each time price tested that zone.
For a Kenyan ZEC holder or any retail position opened on the recent breakout above $300, the $294 level is the line to watch. A daily candle closing below it changes the picture.
The broader technical picture adds context. ZEC has added over 53% in the past 30 days according to Changelly’s latest data, touching above a $10 billion market cap briefly during the spike. The pullback to the orderflow zone looks corrective rather than distributive, but volume needs to hold up into the weekend close.
Structure Is Patient. The Entry Window May Not Be.
CryptoPatel’s note on X called for waiting for retracement into the orderflow zone and bullish confirmation before moving toward buy-side liquidity. That window appears to be opening now.
The HTF structure, meaning the higher timeframe weekly and daily charts, still targets external highs above $750. But the daily close below $294 remains the hard stop on that picture.
One scenario that could interrupt the move: if weekly volume fails to confirm by Friday’s close, the retracement could deepen past the orderflow zone and delay the setup. The structure would still be valid, but the timing would shift.
Targets: $643 as first draw, $750 as external liquidity. Invalidation: daily close below $294.