NEAR Protocol has given back nearly everything from its last bull cycle. The token peaked near $20 and now trades around $1.57, a drop of roughly 93% from that high. That kind of decline wipes out most late buyers. But on the weekly chart, something is shifting that a specific group of traders is paying close attention to.
The weekly chart shows NEAR has respected a macro descending channel since the cycle top. Lower highs and lower lows all the way down, with brief rallies used to distribute at premium levels each time. The $2 zone that once held as support flipped into resistance, confirming the bearish structure that trapped buyers during those weak bounces.
Liquidity Sweep and the Zone That Matters Now
According to CryptoPatel, on X, price has now swept sell-side liquidity below range lows and is reacting from what he identifies as a strong higher timeframe bullish order block.
“The Current Range Represents A High-Probability HTF Accumulation Zone For NEAR/USDT Ahead Of A Potential Expansion Phase Once Channel Resistance Is Broken.”
That order block sits between $0.95 and $1.20. CryptoPatel notes a multi-year ascending trendline is still holding support in that zone, with a confirmed liquidity sweep below the dynamic trendline. The SSL grab, he says, is confirmed. Risk invalidation for the entire bullish thesis sits at a weekly close below $0.85.
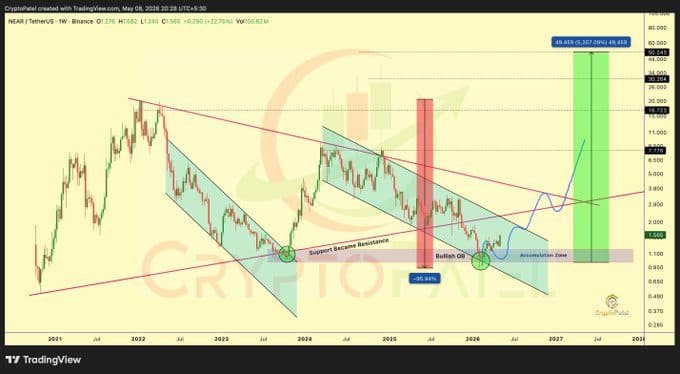
The weekly chart shared by CryptoPatel on X shows the full picture: a green accumulation column placed between roughly 2026 and 2027 with bull cycle targets mapped at $4, $8, $16, $30, and $44 to $50. Short-term upside potential sits at around 400%, with macro expansion targets of 3,000% to 5,000% from the current accumulation zone. Bullish structure, he says, is only valid above a $3.20 channel reclaim.
Daily Chart Tells a Different Story Right Now
The daily chart is where the near-term setup is clearer. EtimEarnest on X flagged NEAR as one of the cleaner reversal setups forming on that timeframe.
“$NEAR is starting to look like one of the cleaner reversal setups on the daily.”
He pointed to a strong accumulation range built between $0.90 and $1.20, with higher lows forming consistently since then. The level traders are now watching is $1.50 to $1.55. If that area turns into support on pullbacks, the next major zones are $1.70, then potentially $1.85 and above. EtimEarnest put a target range of $2.20 to $2.40 as a realistic near-term move if that structure holds.
The daily chart analysis is supported by several technical indicators visible in the chart. The RSI is showing bullish divergence while MACD has produced a bullish crossover, with momentum described as turning up. The OBV, on-balance volume, has broken out and is making higher highs, which points to buyers showing accumulating strength beneath the surface. The 200 EMA sits above current price but the chart shows price pushing back toward it, a move that would be significant if it holds.
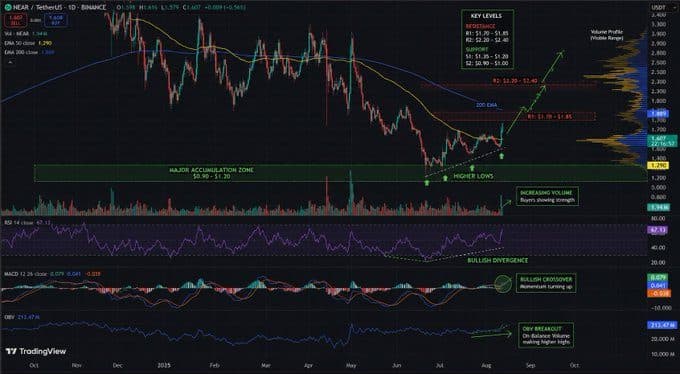
Key resistance levels on the daily are marked at R1 ($1.70 to $1.85), R2 ($2.20 to $2.40), and higher zones through $3.20. Support sits at S1 ($1.36 to $1.39) and the major accumulation zone floor at $0.90 to $1.20.
What the Confluence Says
The weekly and daily charts are telling two parts of the same story. The weekly is showing a completed markdown phase with a confirmed liquidity sweep and reaction from a bullish order block. The daily is showing that reaction is producing higher lows, bullish momentum indicators, and increasing volume from buyers.
The previous cycle high of $20 is now labeled by CryptoPatel as an exit liquidity zone, not a target. Real expansion, he says, starts after a structure shift, not during the downtrend. That structure shift requires reclaiming $3.20 on the weekly.
The people who ignored NEAR at $1.20 are now paying attention around $1.57, according to EtimEarnest’s read of the setup. That dynamic, buyers arriving after the early accumulation is already done, is what typically defines the transition from accumulation into the early markup phase.
Whether NEAR makes it to $3.20 and beyond or retests the $0.85 to $1.20 demand zone again before any expansion is the open question. Both analysts agree that position sizing and risk management matter in this range. The technical structure is building. The confirmation still needs to come through price action.
Disclaimer: This article is for informational purposes only and does not constitute financial advice. Cryptocurrency investments carry significant risk. Always conduct your own research before making any investment decisions.