$SUI is trading at $0.9654, up 3.93% on the day. The move cleared a descending trendline that had been rejecting every recovery attempt since the October 10 crash, a line that held as overhead resistance for several months running.
Higher-timeframe support at the base of the structure stayed intact through the entire correction. That floor held. Now price is above the ceiling.
The October Line Is Gone
The descending trendline from October 10 was not subtle on the chart. It sat overhead through November, December, January, capping every attempt to recover. Each bounce rolled over beneath it. Each lower high confirmed that sellers were still running the show.
That structure broke this week. The candle on the SUIUSDT chart pushed cleanly above the trendline and through a horizontal green resistance zone sitting near the $1.55 region. Both cleared in the same move.
As Community_Sui posted on X, “$SUI just broke above bearish resistance dating back to the 10/10 crash. This is a significant milestone, as it clears the way for further growth, with limited resistance levels above.”
The HTF support label visible at the base of the chart held throughout the drawdown. That base now sits well below current price, giving the breakout room underneath rather than a fragile ledge.
What the Chart Structure Says
The chart shows a clean descending channel running from the October high down through early 2026. Price grinded along lower highs inside that channel for months. Each failed breakout attempt added to the weight of the resistance.
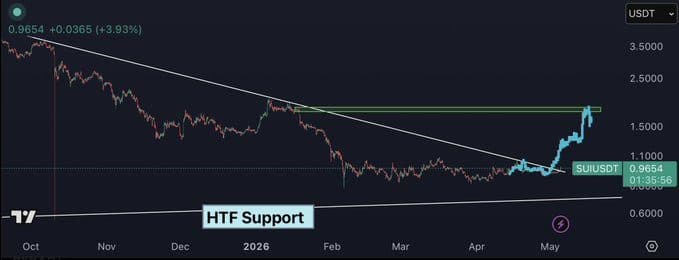
The current candle is different. It is sharp, blue, and body-heavy through the resistance zone. That is not a wick poke. The move ran from HTF support all the way through the trendline and the horizontal zone above it, in one clean sequence.
The breakout zone near $1.55 now becomes the level to hold. A close back below it would raise questions about whether this is a real structural shift or another failed attempt. So far the candle structure says otherwise.
Limited Resistance Overhead
Community_Sui wrote on X that the path above carries “limited resistance levels” and called the upside potential “substantial,” with a direct target of $2 and beyond.
The chart supports that reading. Between the current breakout zone and $2.00, the chart shows no major structural supply to fight through. The horizontal levels that previously acted as resistance are now behind price.
That does not make $2 automatic. Breakouts without sustained follow-through can fade back to the breakout zone. The key is whether buyers defend the $1.55 region on any pullback.
What changed today is structural. The trendline from October 10 held SUI down for months. It is broken now. Holders who accumulated near HTF support have a clear technical argument in their favor, and for the first time since the crash, the chart is not fighting them from above.
Disclaimer: This article is for informational purposes only and does not constitute financial advice. Cryptocurrency prices are highly volatile and past price action does not guarantee future results. Always conduct your own research before making any investment decisions.