Has Bitcoin given up its support level? No. No daily close has come in below the $62,000 mark despite dips to $62,006 on November 15 and $62,063 on November 18.
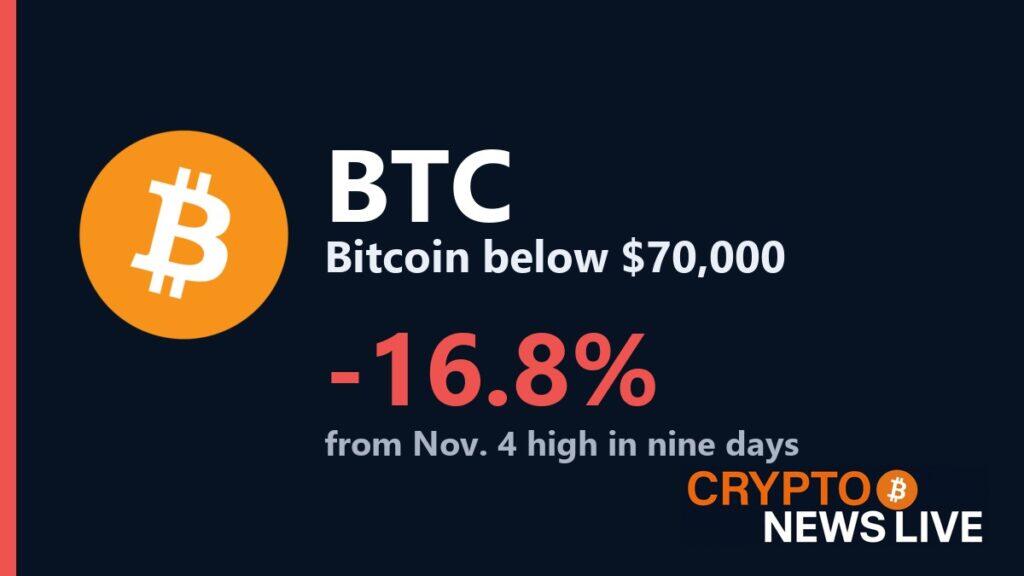
Now that prices have dipped to $62,900, the Bitcoin 62K support level is under real pressure for the first time since the summer season. Bitcoin was trading at $62,900 on November 19, 2026, which marks a decline of 16.5% from its last closing at $75,368 on November 9. So the million dollar question for Bitcoin holders is whether it can hold on here or break down to the levels seen in June and July.

How far did Bitcoin fall into the 62K band?
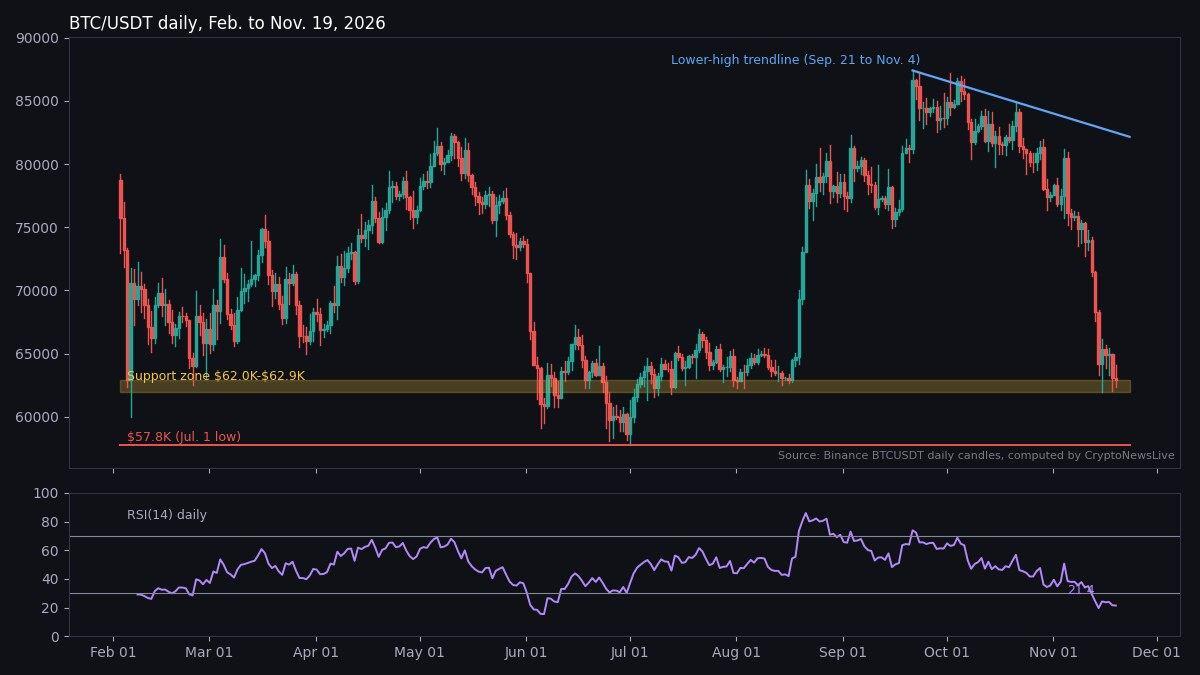
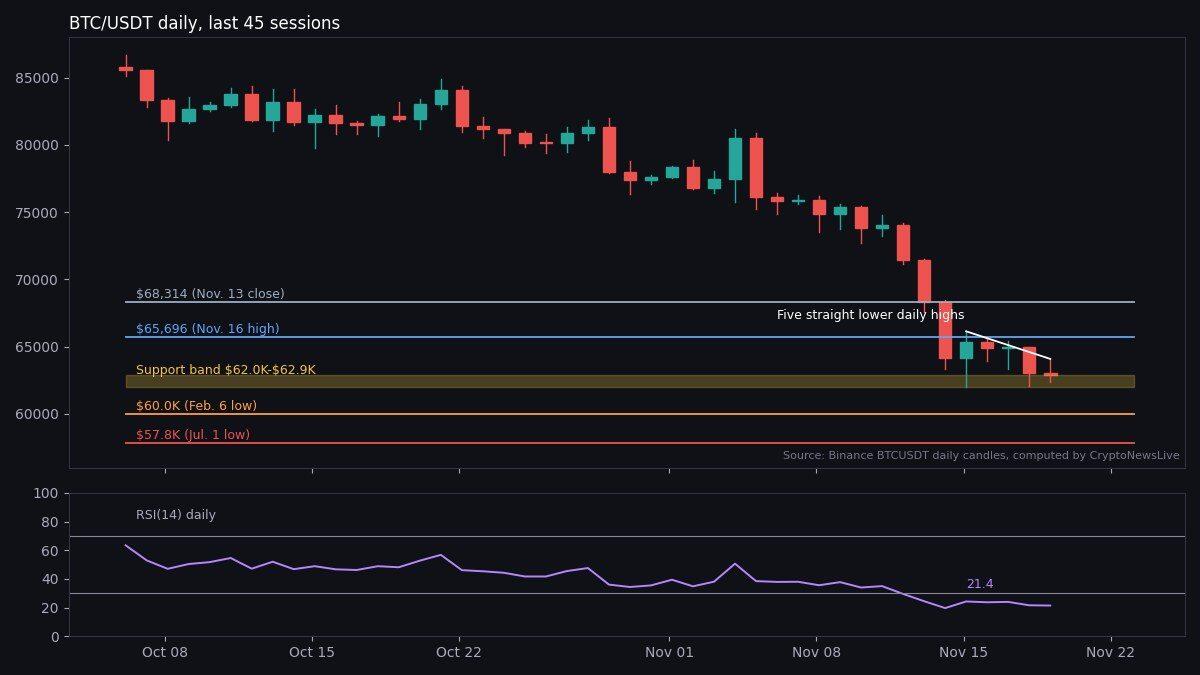
Bitcoin recorded a high of $87,395.67 on September 21 and is now roughly 28% lower since then. Price fell sharply during November. Closing values of $71,460 on November 12, $68,314 on November 13, and $64,150 on November 14 each fell below the previous value, causing Bitcoin to fall by 13% from a closing price of $74,015 on November 11. The initial CryptoNewsLive post on the Fed meeting addressed this first leg of decline where Bitcoin was trading around $64,800.
The recoveries have been very brief. Daily highs were $66,132 on November 15, $65,696 on November 16, $65,447, $65,002 and $64,081 over five consecutive days from November 15. Each high is lower than the previous, creating a clear downtrend pattern.
Why does $62K keep showing up on the chart?
The Bitcoin 62K support region is not new since the asset has already found itself in this region. According to the Binance daily chart, there were 23 times when the low occurred in the range of $62,000-$62,900 from late January till now; in February, June, July, August, and November. The low of February 5 was at $62,345.
By definition, support is a level where the buyers appeared in the past; however, the level can be considered valid only when it holds. However, this particular level did not always hold. On 13 days from June 5 until July 2, the closing Bitcoin price was under $62,000; and it hit the lowest at $57,800.19 on July 1.
What have the spot Bitcoin ETFs done on the way down?
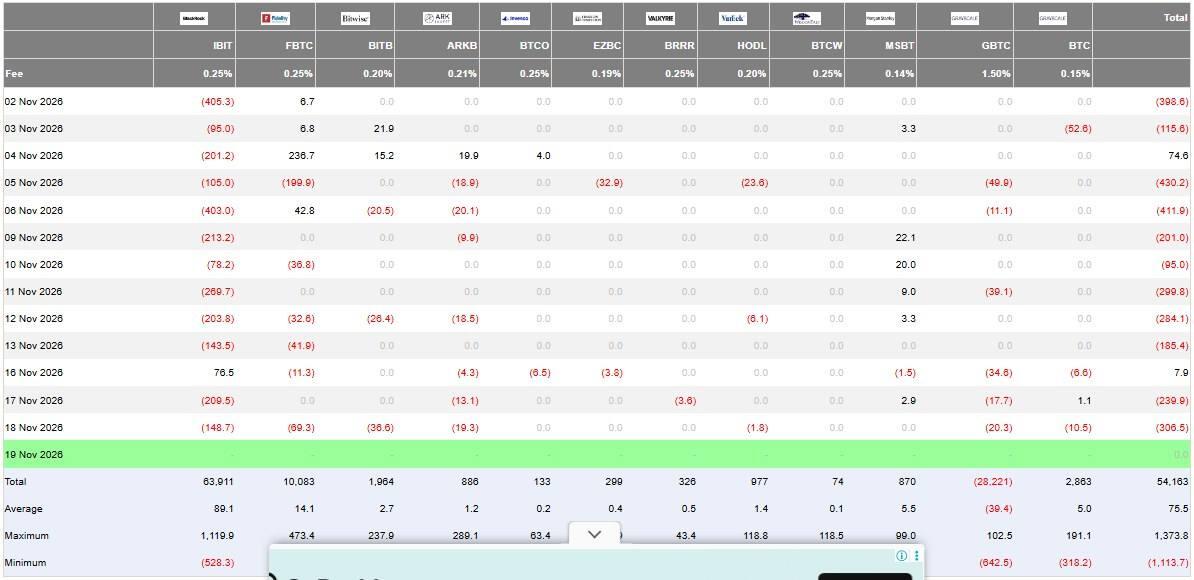
US spot Bitcoin ETFs have sold through the full slide. Farside Investors reports a total outflow across 11 out of 13 trading sessions between November 2 and November 18 at $2.89 billion. On November 18, outflows amounted to $306.5 million in which case BlackRock’s IBIT contributed by $148.7 million.
Only on two out of those 13 sessions did flows go into the market: November 4 for $74.6 million and November 16 for $7.9 million. It is still unclear how much inflow there was on November 19, as this information was not made available yet.
What do prediction markets and the RSI say?
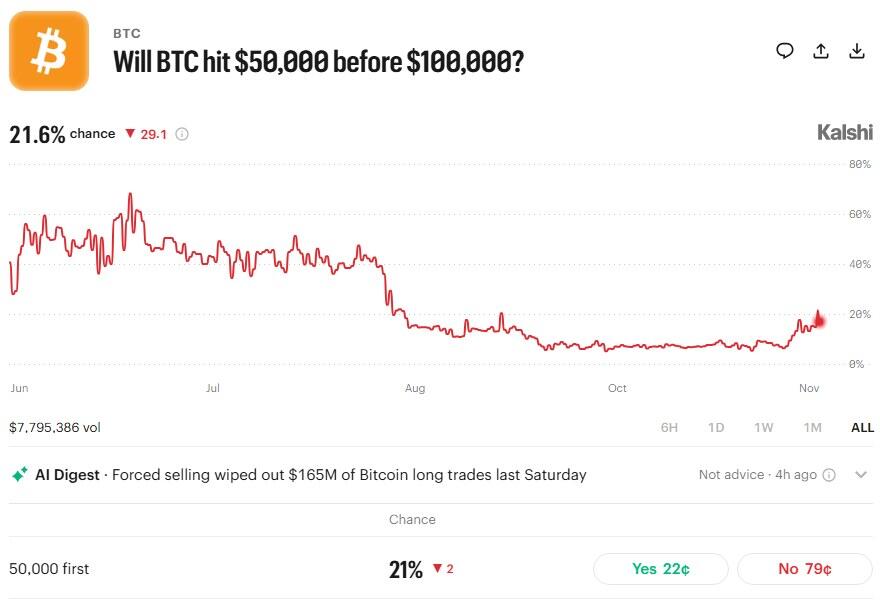
According to the prediction market site Kalshi, the probability assigned to the probability of Bitcoin hitting $50K before $100K by December 31, 2026 was estimated at 21.6% on November 19. This graph on this particular website displays the price action for the aforementioned market below 10% until October.
The RSI that calculates relative strength in terms of 0 to 100 on a daily basis currently reads 21.4, and anything below 30 is defined as oversold, especially in a downtrend where the indicator remains depressed for long periods. Before this selloff, the last time the RSI for Bitcoin fell this low was June 2 to June 10, when it bottomed at 15.5, and price still hit a low of $57,800 on July 1.
What would change the picture?
A daily close above $65,696, the Nov. 16 high, will put an end to the succession of lower highs and signal a start of a rally towards the Nov. 13 close of $68,314, and the scenario is voided by a daily close below $62,006 first. A daily close below $62,006, Nov. 15 low, would be a sign that Bitcoin 62K support was broken, making $60,000 and then $57,800 levels playable, but this scenario is voided if there is a close above $65,696.
Although the price is under its descending line of lower highs, the probabilities favor a downward movement, but an RSI of 21 is keeping the chances of a rebound in play. Crypto is volatile and people can lose money, and this is analysis of price data, not investment advice.
Is the drop only a Bitcoin story?
This is happening not only to Bitcoin. The price of Ethereum is down by 12.4% since its Nov. 12 close at $2,019.74 compared to 12.0% of Bitcoin from $71,460, and XRP traded below $1 while the open interest declined by 38%.