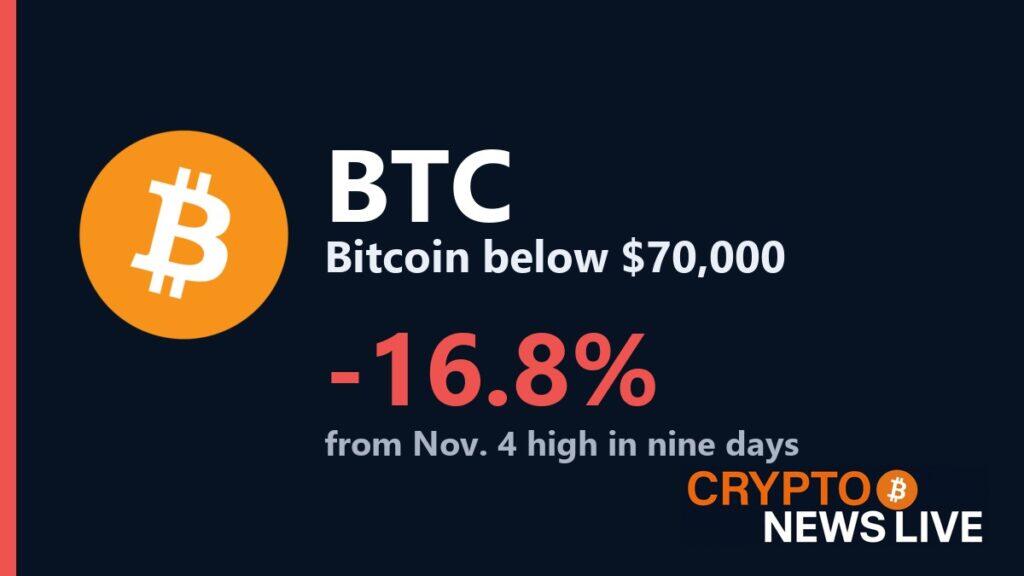
Bitcoin fell below $60,000 on Nov. 20 for the first time since July 2, touching $58,769 on Binance before trading near $59,400 at 16:25 UTC. The slide leaves Bitcoin 32% under its Sept. 21 high of $87,396 and about 21% under its Nov. 9 close of $75,368.
The move followed a daily close of $61,987 on Nov. 19, the first close under $62,000 since July 2, a level CryptoNewsLive examined in its Nov. 19 report on the $62,000 support band. With Bitcoin below 60K, leveraged traders, ETF investors and stock markets were all under pressure at once.

How many traders were forced out below 60K?
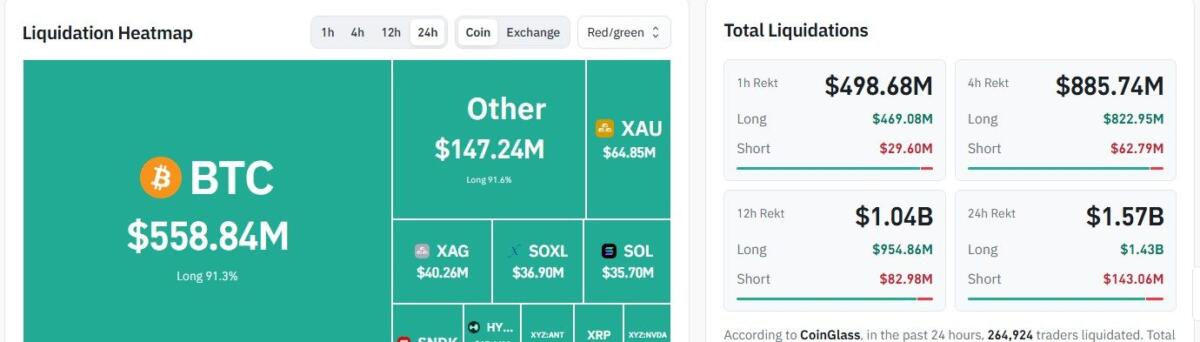
Coinglass data showed $1.57 billion of crypto positions liquidated in the 24 hours to about 16:25 UTC on Nov. 20. Longs, which are bets on a price rise, made up $1.43 billion of that, and shorts $143 million. A liquidation happens when an exchange closes a leveraged position because the trader’s losses have used up the money put behind it.
Bitcoin alone accounted for $558.84 million, and 91.3% of it was long positions. “In the past 24 hours, 264,924 traders liquidated,” Coinglass said on its liquidation page.
Are Bitcoin ETF investors leaving?
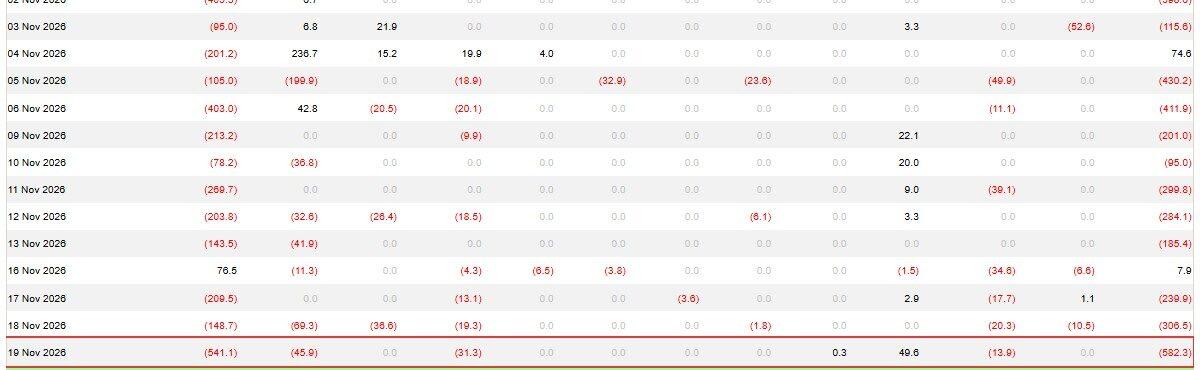
US spot Bitcoin ETFs recorded net outflows of $582.3 million on Nov. 19, according to Farside Investors. BlackRock’s IBIT accounted for $541.1 million of it. Funds have seen outflows on 12 of the 14 sessions since Nov. 2, a combined $3.47 billion, with inflows only on Nov. 4 and Nov. 16. Figures for Nov. 20 had not been published when this article was written.
Did stocks fall too?
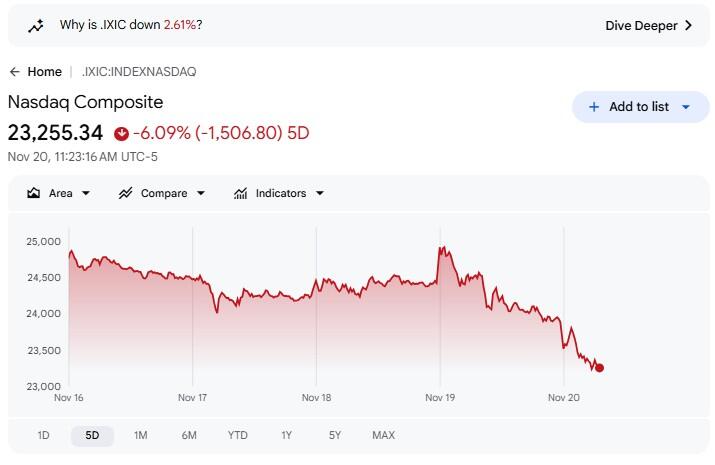
They did. The Nasdaq Composite was down 2.61% on the day at 11:23 a.m. Eastern on Nov. 20 and 6.09% over five days, Google Finance showed. Bitcoin and technology shares have fallen in the same week. The data does not show that one pushed the other.
Where are the Bitcoin levels now?
Bitcoin below 60K leaves the July 1 low of $57,800 as the nearest line on the chart. That is the lowest daily low in the past 200 days of Binance data, and about 2.7% below where Bitcoin traded at 16:25 UTC. Above, $62,000 is the level that gave way on Nov. 19, and $60,000 is the round number lost on Nov. 20.
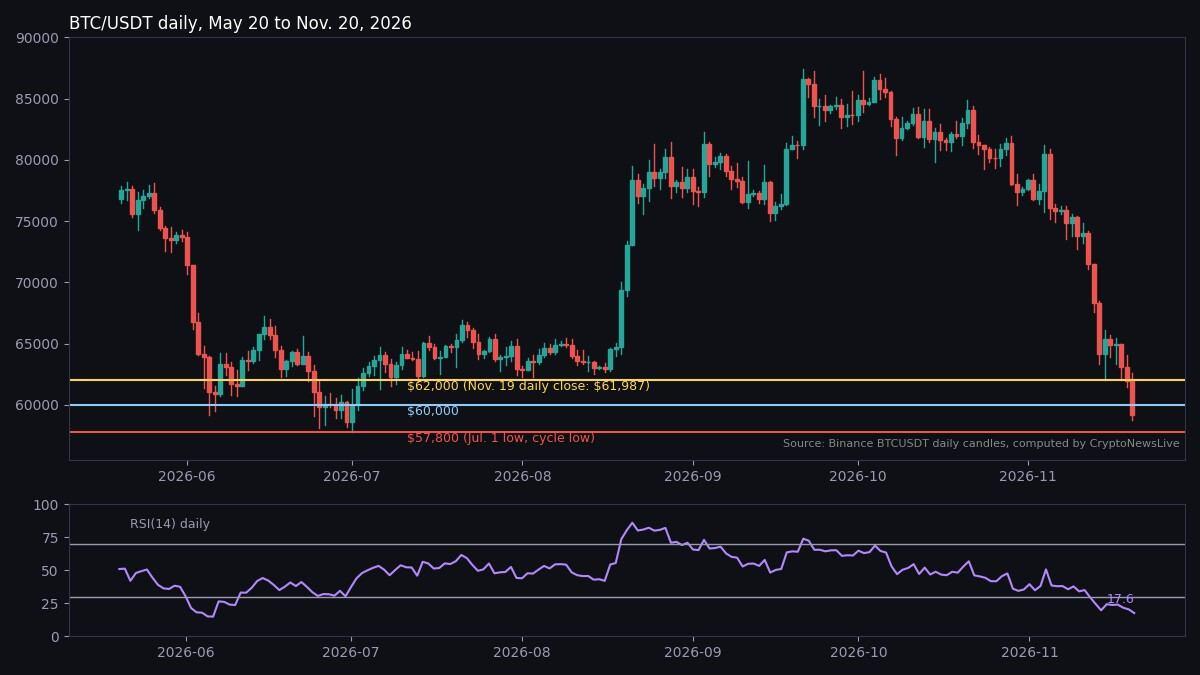
The daily RSI, a 0 to 100 gauge of how hard price has fallen against its recent moves, read 17.6 at 16:00 UTC. Readings under 30 are called oversold. It fell to 14.9 on June 6, and Bitcoin still made its July 1 low three weeks later, so a low reading has not marked the bottom before.
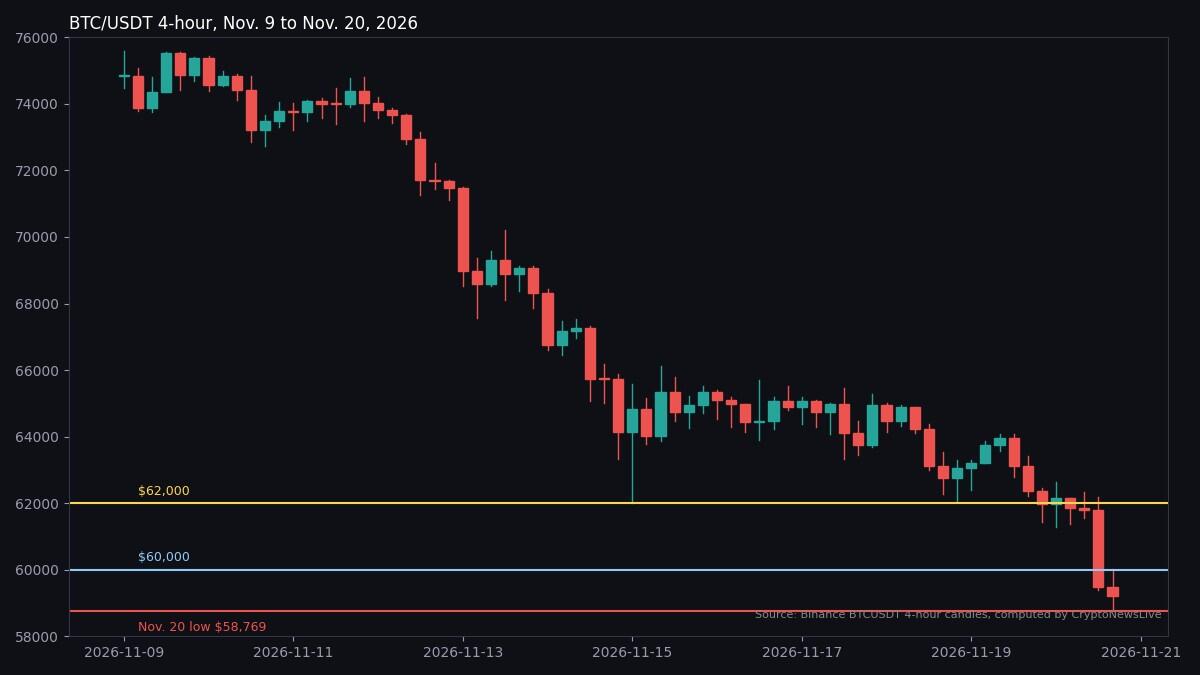
On the four-hour chart, Bitcoin held between about $61,300 and $62,650 from 20:00 UTC on Nov. 19 to 12:00 UTC on Nov. 20. The next candle opened at $61,808, fell through both $62,000 and $60,000, and closed at $59,475. Bitcoin was near $64,800 on Nov. 16, when CryptoNewsLive previewed the FOMC minutes.
What would change the picture?
A daily close back above $62,000 would put Bitcoin back above the line it held on every daily close from Nov. 15 to 18, and the break below $60,000 would then look like a sweep rather than a new leg down. That scenario is void if Bitcoin trades under the Nov. 20 low of $58,769 first.
A daily close below $60,000 would keep Bitcoin below 60K and leave the $57,800 July low as the next line. The scenario is void on a daily close above $62,000. Bitcoin is under its 100-day average of about $77,700 on Binance, so the trend leans down, but an RSI near 17 and liquidations of $1.43 billion in longs mean much of the forced selling may already be done. Crypto is volatile, people can lose money, and prices can move far past any line. This is analysis, not investment advice.
Sources: Binance, Coinglass, Farside Investors and Google Finance, all checked on Nov. 20, 2026.