1. Bitcoin has reached a major trendline, with wave (3) risk pointing toward $39K by autumn 2026.
2. The 50-month EMA sits at $66.2K. No confirmed candle close below it yet in the current cycle.
3. CryptoPatel flagged $50K as the next lower low target after Bitcoin dropped 19% from $82,800.
Bitcoin price analysis 2026 is turning bearish fast. Bitcoin dropped to a key trendline on the daily chart, and several technical analysts are now pointing toward levels that would have seemed extreme just months ago.
The drop pulled BTC from $82,800 down to the $67,000 range. That is a clean 19% move lower, and it did not happen randomly.
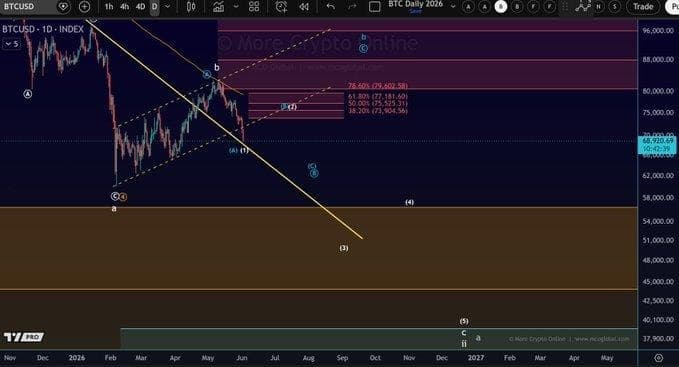
Chart: More Crypto Online — Bitcoin daily wave structure with $39K projection (via X)
What the Wave Count Is Saying
According to More Crypto Online on X, Bitcoin has reached the trendline and there is real risk it has entered wave (3) of a larger bearish structure. The main pushback against that read is how oversold Bitcoin already looks at this stage.
“If this larger bearish structure continues to play out, it would also suggest that Bitcoin could revisit the $39,000 region sometime in autumn this year.”
That $39K figure is not a typo. It is the wave (3) and wave (5) projection on the daily chart shared by More Crypto Online, with targets cascading down through $45,000 and $40,000 before the structure would complete.
The 50-month EMA is sitting at $66,200. ChartNerdTA noted on X that in every prior Bitcoin cycle, price has printed a candle close below that level at some point during the correction phase. So far in 2026, BTC wicked beneath it but has not confirmed a monthly close under it.
“We wicked beneath it in early 2026, but have not yet confirmed a candle close below. The 50 MEMA currently rests at $66.2K.”
That distinction matters. A wick is not confirmation. Traders watching the monthly close will treat a close below $66,200 as a structural shift.
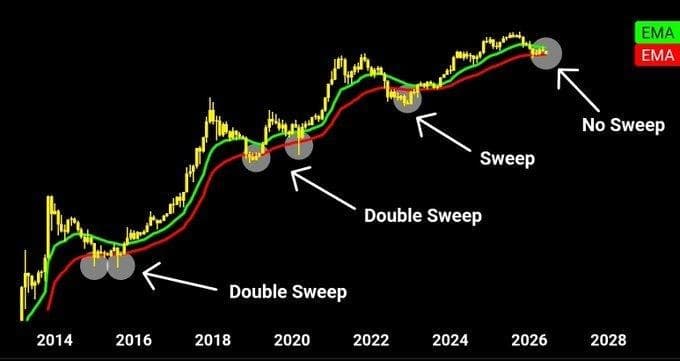
Chart: ChartNerdTA — Bitcoin 50-month EMA historical sweeps across cycles (via X)
The SMC Read From CryptoPatel
CryptoPatel laid out the full trade on X before the drop happened. The setup was a liquidity grab into a fair value gap at $82,800, followed by a move toward the $68K zone. The result was a drop to $67,000.
“Liquidity Grab, FVG, Order Block. Most people never see it coming. I layer market psychology on top of the technicals, that is where the accuracy comes from.”
Now CryptoPatel has shifted the stop loss from $98,000 down to $82,800. That level is the change of character trigger. A high-volume close above it on the higher time frame would flip the bias bullish. Until then, the bias stays lower.
The next lower low target is around $50,000. A break of the break of structure at $59,800 opens the door to that level. If momentum stays heavy past $50K, the $45K to $40K range comes into play after that.
A short-term relief bounce toward $75,000 is possible before the next leg lower. That bounce would form a lower high in the current structure, which has been building since January 2026.
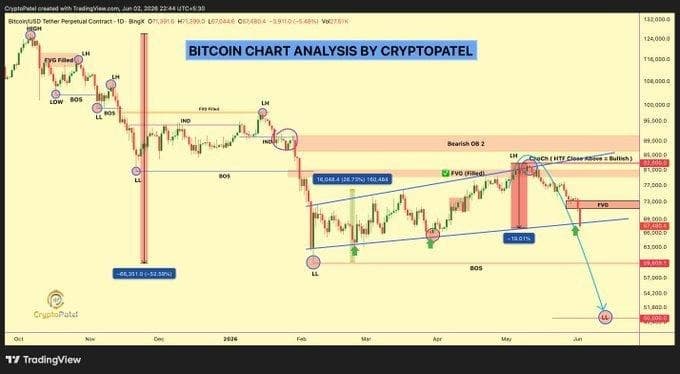
Chart: CryptoPatel — Bitcoin SMC analysis with $50K lower low target (via X)
50-Month EMA and Historical Cycle Behavior
The 50-month EMA has played a specific role in every prior Bitcoin cycle. Price swept it, sometimes twice, before the next leg higher. The 2026 wick below $66,200 fits that pattern but has not yet confirmed.
CryptoPatel also flagged a possible relief bounce toward $75,000 before the next leg lower. That bounce, if it comes, would be a lower high in the structure. The long-waiting lower high finally formed, according to CryptoPatel. That confirmation was the last piece of the bearish setup.
No close above $82,800 on high volume, the broader directional read stays pointed lower.