Bitcoin is back near $66,200 this week. That’s up sharply from the $57,800 low it printed less than a month ago, and if you only look at the short charts, the move looks clean. A sweep, a reversal, then higher lows all the way back up. Zoom out to the weekly candles though, and the story gets a lot less tidy.
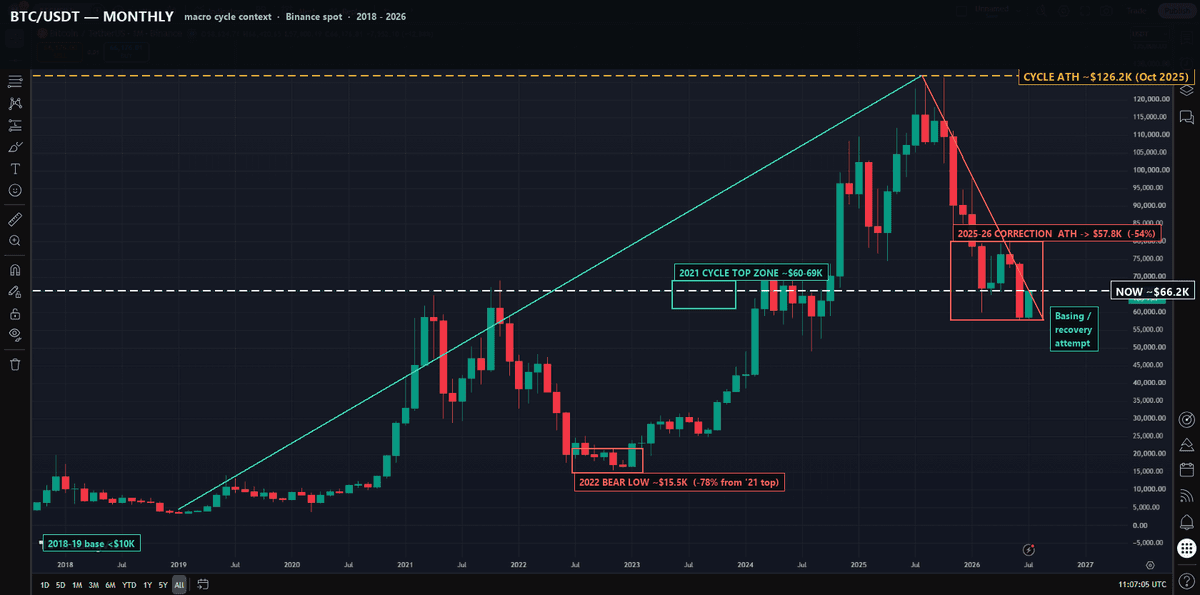
Because the bigger picture here is still a correction. A big one. Bitcoin printed an all-time high near $126,249 in October 2025, according to TradingView data on the Binance BTC/USDT pair, and then spent the next eight or nine months giving back 54% of it. Two separate legs down, not one straight drop: first to roughly $70,000 in January, a bounce to about $81,500 in May, then the real capitulation wick into the high $57,000s. That’s the kind of drawdown covered before on this site (see the earlier piece on how deep this cycle’s pullback has already gone), and on the monthly chart it barely registers as unusual for Bitcoin. Painful, yes. Historic, not really.
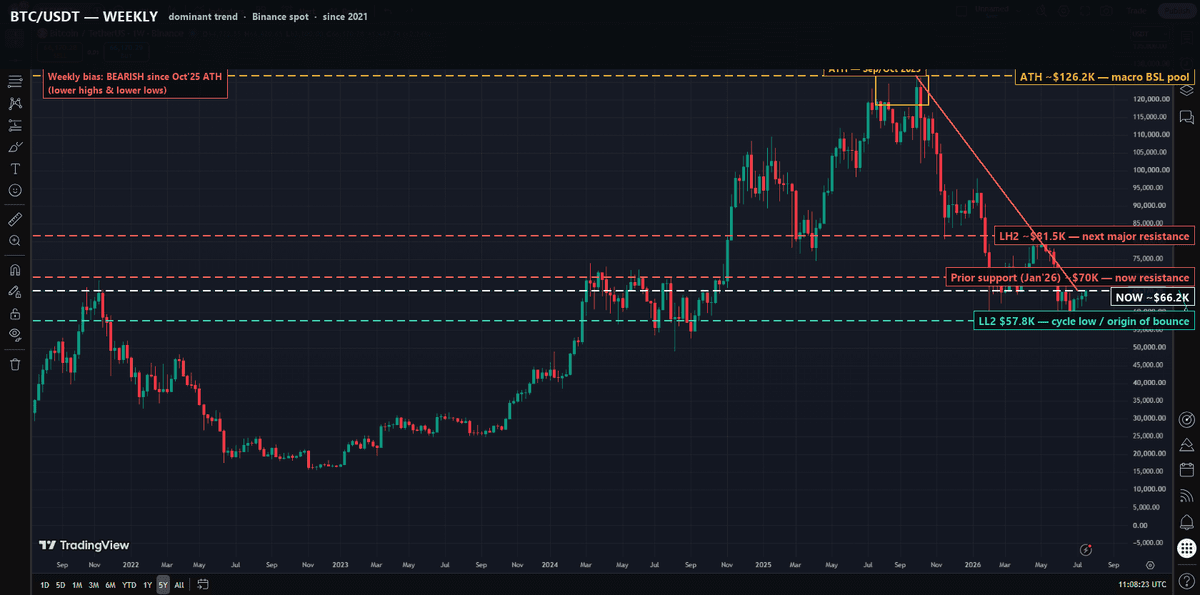
Weekly is where the drawdown actually shows its teeth. Since that October top, price has done exactly what a bearish trend is supposed to do: break the old lows, respect the old highs. January’s low near $70,000 got taken out, then flipped into resistance. May’s bounce topped out at $81,500 and never came close to threatening the downtrend. Every rally since the peak has stopped lower than the one before it.
So which chart is lying? Neither, really. This is just what a counter-trend bounce inside a larger downtrend looks like while it’s still happening. The daily chart is the one that actually settles it, and it points at one specific band: $70,000 to $72,000.
Two separate methods land on that same shelf. First, it’s the last down-close daily candle before the June breakdown, the kind of level traders who track order flow expect price to react to on the way back up. Second, it sits almost exactly on the 0.5 to 0.618 Fibonacci retracement of the May-to-June leg down, the classic optimal-trade-entry pocket. Two different tools, same $2,000 window. That’s not really a coincidence.
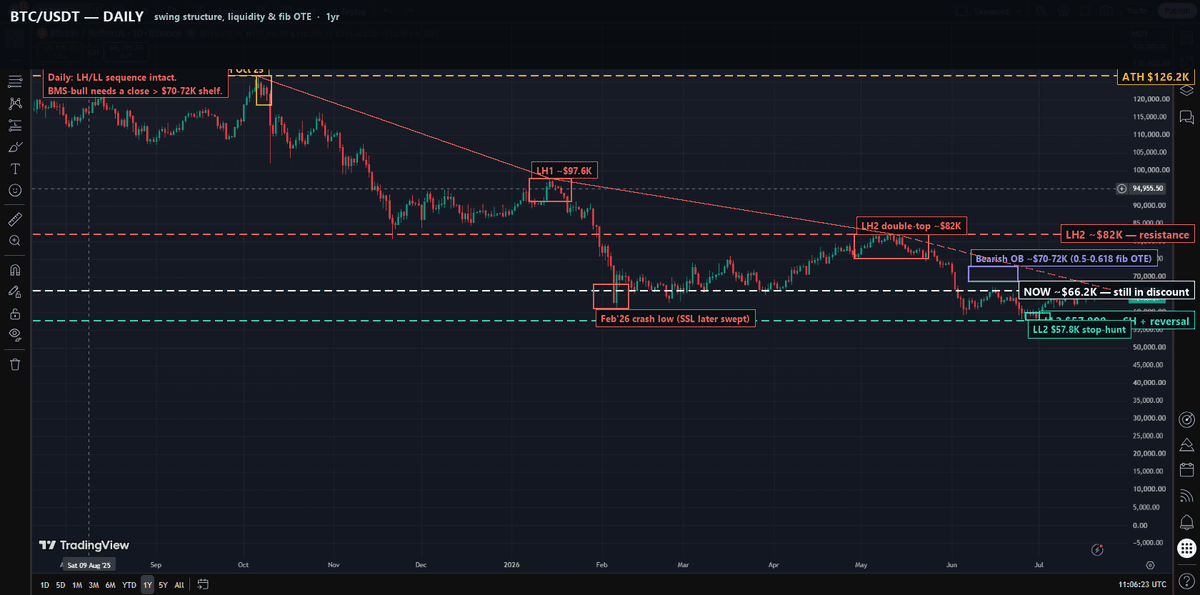
Worth saying plainly: $66,200 is still cheap by this drawdown’s own math. Price hasn’t even reached the shallow 23.6% retracement of the full move from $126,249 down to $57,800 yet. Bulls calling this expensive on the daily timeframe are, bluntly, wrong about the numbers, whatever the price feels like after watching it fall for most of a year.
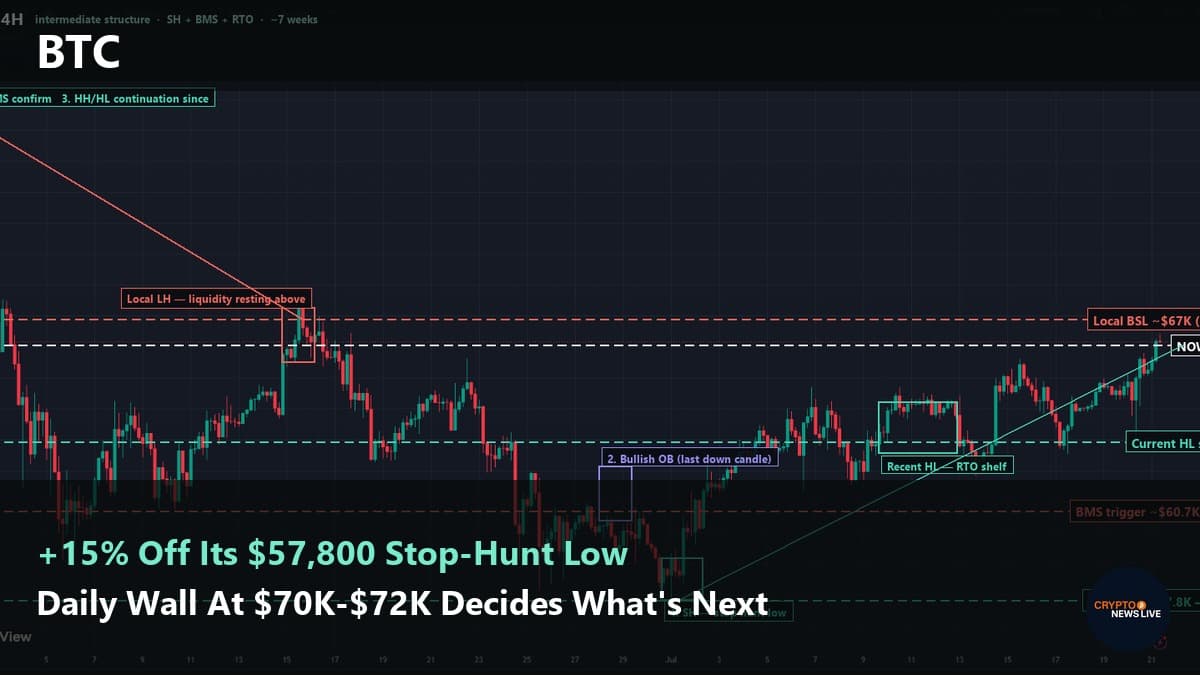
Drop down to the 4-hour chart and the mechanics of this specific bounce get a lot clearer. It’s almost a textbook case. Price wicked hard through $57,800, swept out the resting stop-loss orders sitting below the prior low, and reversed within hours. That’s a stop hunt in the plainest sense. From there it broke back above the swing high near $60,700, confirming the shift in structure, and hasn’t looked back since. Every dip since that low has printed a higher low, not a lower one.
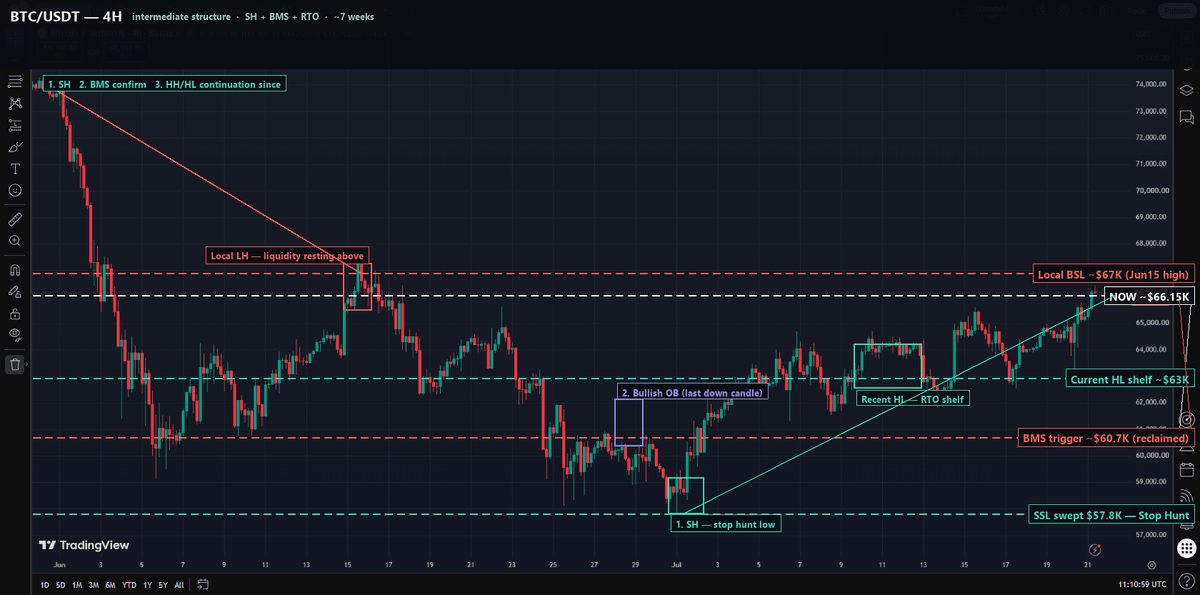
The order block from that reversal, the last red 4-hour candle before the bounce started, sits around $61,000 to $62,000 and hasn’t been retested since. As long as that holds, the near-term structure stays bullish, full stop. The immediate fight right now is at the local high near $67,000 set back on June 15, resting liquidity that’s been sitting untouched for weeks.
Hourly candles fill in how patient this move has actually been. Not one clean shot up, but three separate higher-low reactions over about two weeks, each one bought before price pushed to a fresh local high. One of those reactions was practically an equal low rather than a clean higher one, which is worth knowing if you’re the type who wants every step to look textbook. It still held.
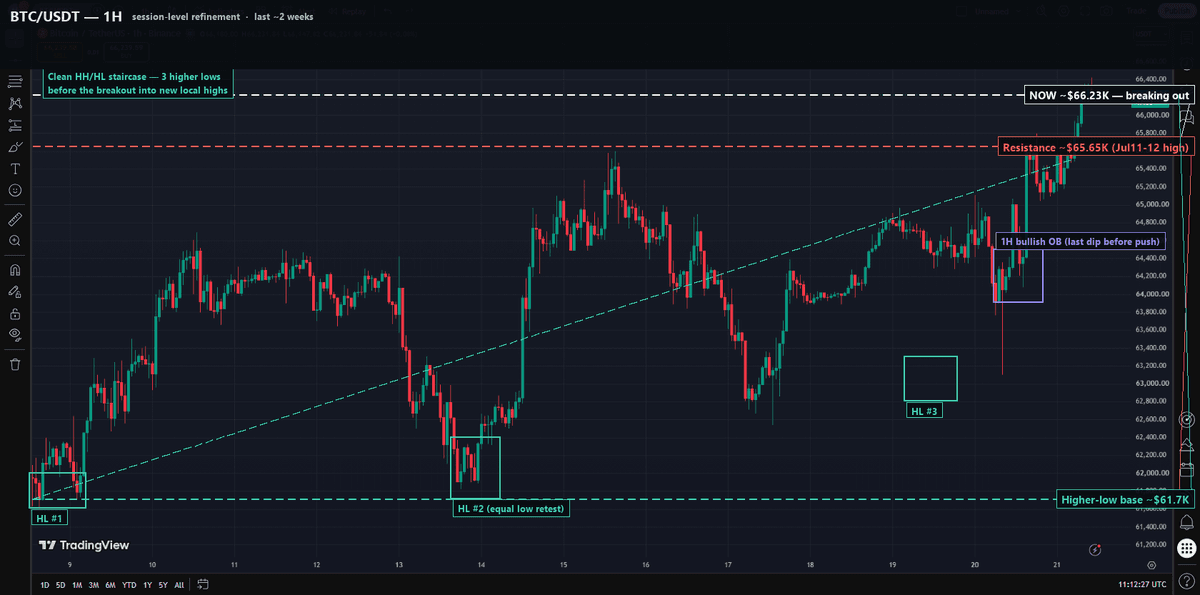
Price had been stuck under $65,650 for the better part of a week before the most recent candles finally cleared it. On the way, a 1-hour order block formed around $64,000 to $64,400, the kind of shelf a shorter-term trader would lean on if this thing pulls back before going further.
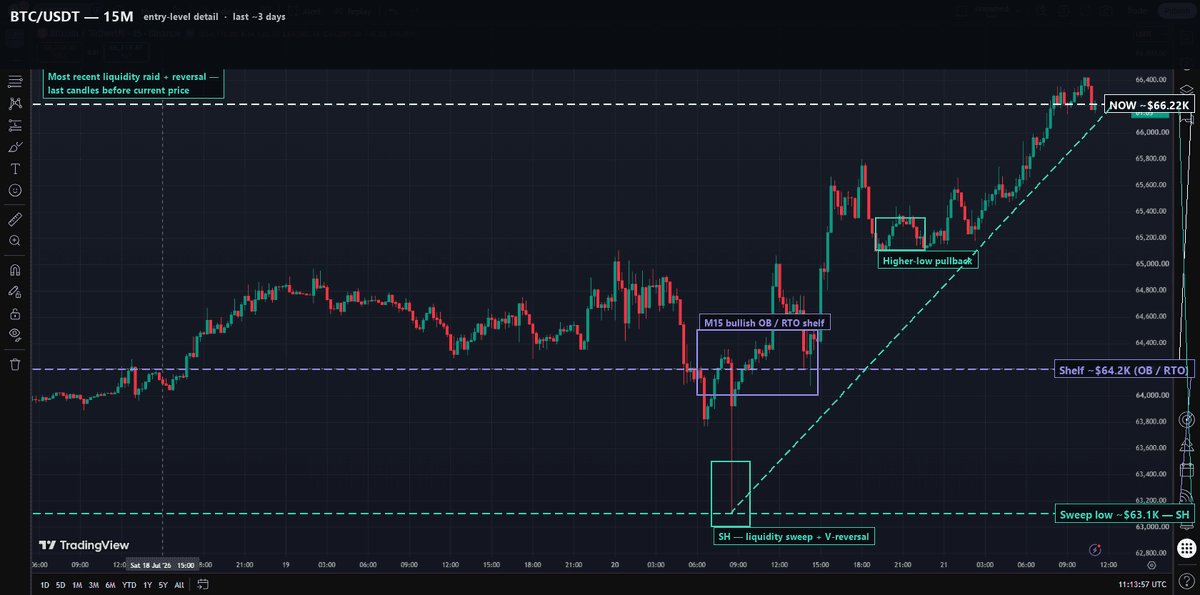
Zoom all the way into the 15-minute chart and you can see the freshest version of the same pattern repeating at a smaller scale. A quick sweep down to $63,100, an immediate V-shaped reversal, and a rally straight back through the $64,200 shelf that had held price down for most of the prior day. That shelf is now acting as the intraday floor. Momentum has carried price into new local highs above $66,300 with barely a real pullback along the way, which is its own kind of warning even inside an otherwise clean uptrend.
Put the six charts next to each other and the read isn’t really complicated, even though it sounds like it should be. Lower timeframes are bullish, cleanly so; the kind of on-chain calm this site flagged during the worst of the decline backs that up too, nothing panicked left in the short-term holder data. Higher timeframes are still bearish until proven otherwise. Both things are true at the same time, and that tension is exactly what the site’s own note on this cycle’s critical structural test was pointing at before this leg even started.
A daily close above $72,000 would be the first real evidence the correction is done, not just paused. Lose the $61,000 to $63,000 shelf on the way there instead, and this whole bounce goes back to being exactly what the weekly chart already says it might be: a relief rally inside a bigger downtrend, nothing more.