Bitcoin has set three consecutive all-time highs. Each time, the Short-Term Holder MVRV came in lower than the one before. That gap between price and sentiment is now compressing toward a trendline that has held without a single break since mid-2024.
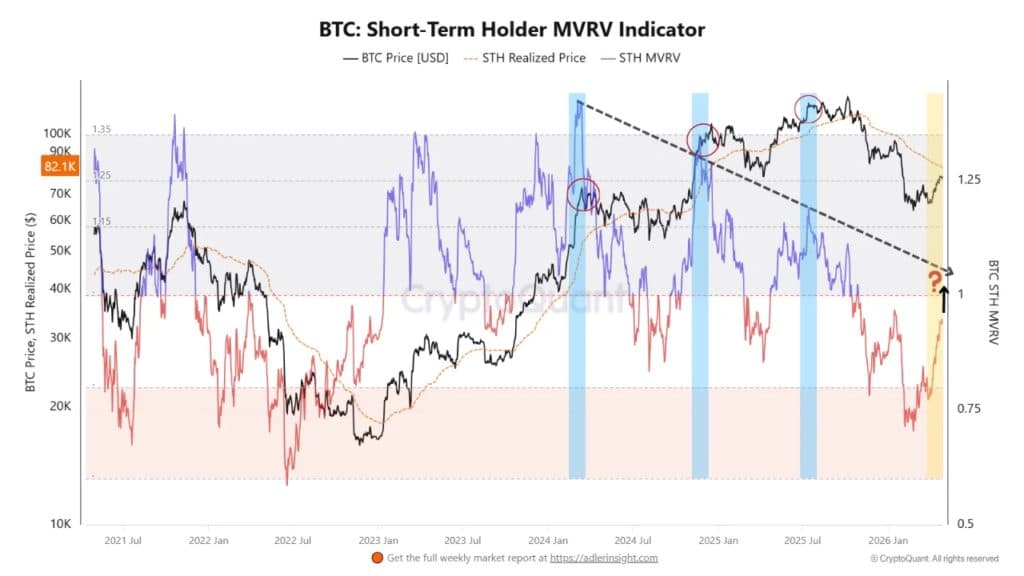
The setup, tracked and published by CryptoQuant analyst MorenoDV, shows a descending trendline connecting three precise structural peaks in the STH MVRV. First in mid-March 2024, when the indicator pushed above 1.4 as Bitcoin hit a then-record near $72K. Then again in late November 2024 as BTC surged toward $106K, but the MVRV peaked lower. The pattern continued into July 2025, when another new high near $120,000 printed while the indicator kept its sequence of lower highs.
Three ATHs, Three Lower MVRV Peaks
Three straight records. Three lower sentiment readings. According to MorenoDV on X, the trendline connecting those peaks has held with what he describes as “remarkable precision.”
The STH MVRV is now compressing back toward that trendline. If it reaches it, that move would coincide with price potentially reclaiming the STH Realized Price, which functions as the aggregate cost basis for short-term holders. That’s the average price at which recent buyers entered the market. Trading back above it shifts that cohort from net loss to net profit.
That shift matters more than it might sound. Short-term holders sitting underwater tend to sell into strength, looking to recover losses. Once they’re back in profit, that overhead pressure starts to fade. The supply dynamic changes.
What a Reclaim Actually Means
CryptoQuant’s analysis lays out the precise condition for a structural shift. It’s not just touching the trendline. It’s what comes after.
MorenoDV writes that a sustained reclaim of the Realized Price, combined with the MVRV stabilizing and trending above 1.0, would be the signal. Not a bounce to it. A hold above it. Those are two separate conditions that both need to be met at the same time.
Until then, MorenoDV’s position is direct.
“Until that confirmation arrives, the trendline remains a ceiling, not a floor.”
That framing has a practical implication for anyone watching position sizing right now. Aggressive upside repositioning ahead of that dual confirmation carries structural risk baked into it, not just price risk.
The Pattern That Keeps Holding
The three-peak divergence structure itself is worth sitting with for a moment. Bitcoin made higher prices each time. The STH MVRV made lower readings each time. That’s the definition of bearish divergence between price action and sentiment on the on-chain side.
What makes this different from standard technical divergences is the cohort specificity. It’s not a broad market indicator. It’s tracking the exact group of people who bought in the last 155 days, their cost basis, and how far above or below that cost basis price is sitting. The divergence showing up three times across three ATHs tells a story about how each rally has drawn less conviction from the people actually buying at the top.
Now that same indicator is approaching the trendline from below at $82,100, right where the chart shows MVRV compressing into the descending structure.
What Allocators Are Watching
MorenoDV’s conclusion in the CryptoQuant note is aimed directly at capital allocators. Monitor both conditions together, he says, before taking aggressive upside exposure. That’s not a call to stay out. It’s a call to wait for confirmation.
The Adler Insight weekly report, which carried the chart, puts BTC price at $82,100 at the time of publication, with the STH MVRV sitting right at that compression point. The question mark on the chart is pointed directly at the 1.0 line, the threshold where short-term holders flip from net loss to net gain.
Either the trendline holds again and the ceiling extends, or it breaks and a structural regime change gets its first real confirmation this cycle. That’s the test. It hasn’t resolved yet.