Where is XRP on Saturday 24 October 2026? Binance spot had it at 1.2930 around 20:30 UTC. The 30-day move is about 15.7% lower, and price rests on top of its 100 and 200-day simple averages and sits between two Fibonacci lines. Any XRP price analysis this weekend starts from that crowded spot.
Every level below comes from Binance candles pulled the same evening. Live figures carry an “as of” because they change by the hour, and closed-candle numbers carry their date.
XRP price analysis on the daily chart: four lower highs
Look at the daily swing highs in order. Wednesday 23 September printed 1.6581. Monday 5 October topped at 1.5310, then Sunday 11 October only got to 1.43. Wednesday 21 October ran out of steam at 1.3992. Each rally ended under the one before it.
The floors are less tidy. Thursday 8 October set a low of 1.3189. Then Tuesday 13, Thursday 15 and Tuesday 20 October each pushed under that low, to 1.3112, 1.2840 and 1.2865, and closed back above it the same day. Three sweeps of one level, and then the level gave way anyway. Sunday 18 October then printed 1.2562, the lowest daily low before today.
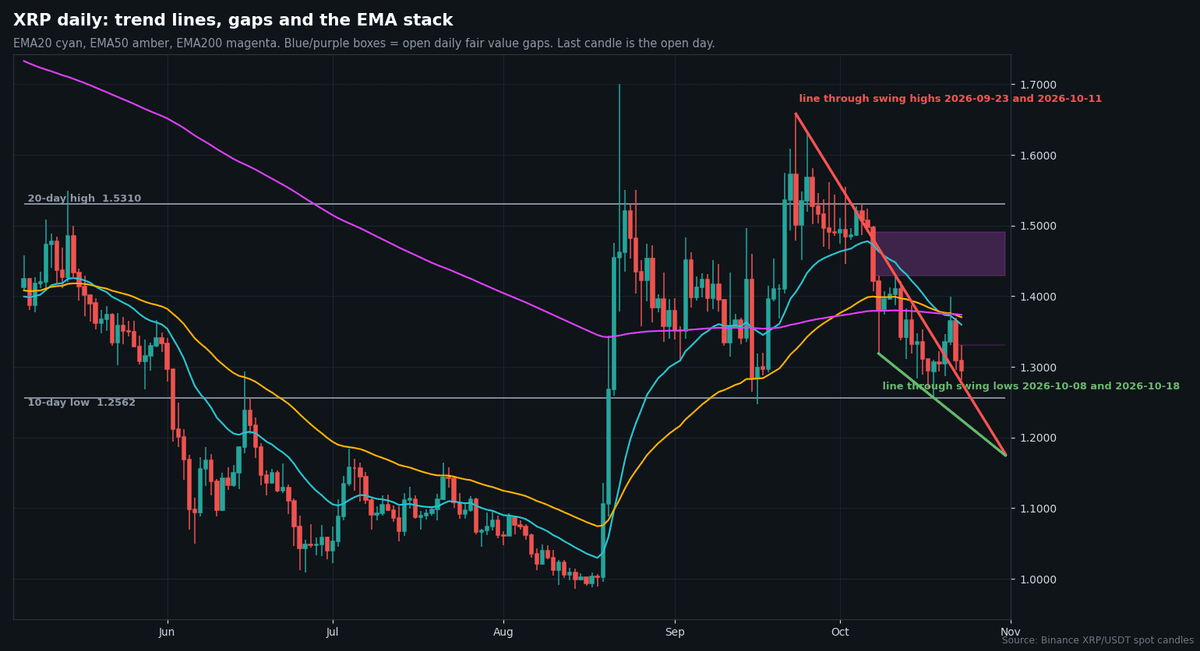
The exponential averages sit overhead and bunched. As of the Friday 23 October close the 20-day was 1.3598, the 50-day 1.3704 and the 200-day 1.3737. Price is under all three. The simple 100-day and 200-day averages are a different story. They sit at 1.2883 and 1.2801, almost under today’s price. Daily RSI reads 38.8, which is low but not an extreme.
Here’s where the lines in the chart come from. The red line runs through the 23 September and 11 October swing highs. The green one runs through the 8 and 18 October lows. Both slope down, and the red one falls faster, so the gap between them narrows. That’s a description of the shape. It isn’t a forecast.
On Monday 5 October we published a top-down XRP piece with a four-hour box from 1.4458 to 1.5617, and it said the first close outside the box would decide things. It came Wednesday 7 October. The four-hour candle that opened at 12:00 UTC closed at 1.4346, under the floor. No four-hour close has been back above 1.4458 since.
XRP price analysis on the four-hour chart
Zoom in and the last four days read like a short story. On Wednesday 21 October price ran to 1.3992 in the 16:00 UTC candle. The next day, Thursday 22 October, two candles poked over the 1.3465 equal highs, with wicks to 1.3698 and 1.3530, and both closed back under them. Then price slid.
In the 20:00 UTC candle on Friday 23 October the four-hour structure broke down through 1.2954, the swing low from Thursday evening. That left a small bearish gap between 1.2961 and 1.3000. Another one sits higher, 1.3328 to 1.3371, from Thursday 22 October at 12:00 UTC. Price is now under both.
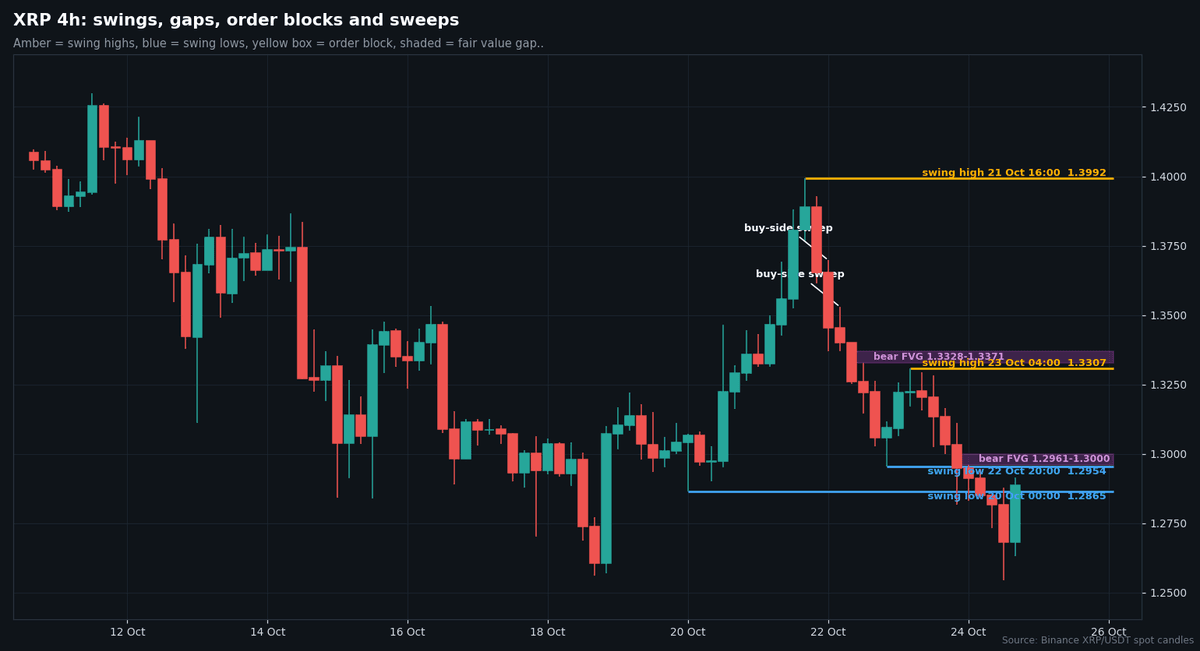
Saturday has been busy. The day’s low was 1.2546 as of 20:30 UTC, which is 0.1% under the 18 October low of 1.2562. Price then climbed about 3% to where it sits now. That’s a wick under an old low followed by a recovery, and it has not closed above anything that matters yet. The next real hurdle is 1.3189, the level swept three times in October.
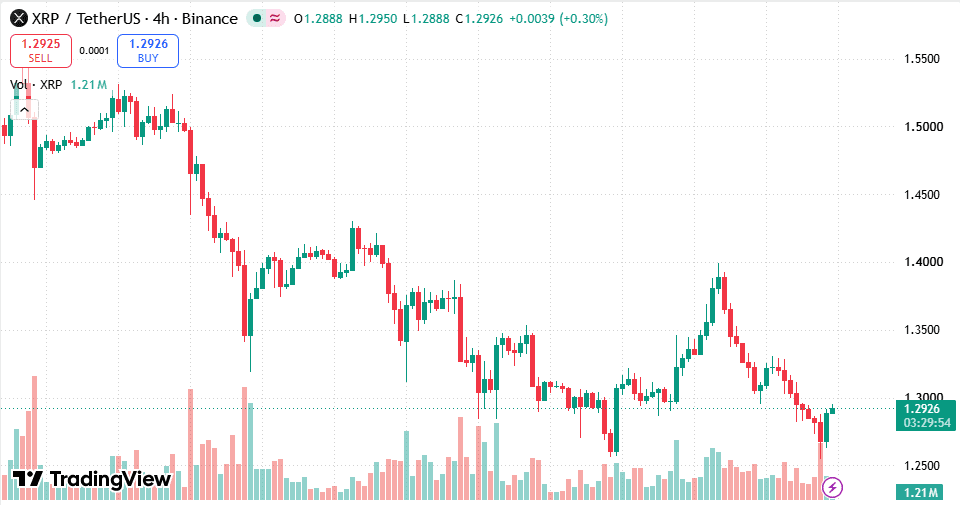
The TradingView 4-hour chart shows the same path with nothing drawn on it, and the slide from 1.3992 is easy to count by eye.
XRP price analysis on the weekly chart: the rally and its Fibonacci retrace
The big picture first for this XRP price analysis. XRP’s weekly structure turned down on 26 January 2026 and hasn’t turned back. The August 2026 low is 0.9862, set Friday 14 August. The rally from there topped at 1.6581 on Wednesday 23 September, a gain of about 68%.
Run Fibonacci lines across that rally. The 0.382 retrace is 1.4014, the 0.5 line is 1.3222, and the 0.618 line is 1.2429. Price at 1.2930 is between the last two. The 16 September swing low, 1.2468, sits right above the 0.618 line. Two methods, two levels, about 0.3% apart.
Weekly averages say a similar thing. The 21-week exponential average is 1.3451 and the 50-week is 1.5094, as of the last closed week. This week’s candle opened at 1.3072. It’s trading under that open, with a weekly low of 1.2546 and a weekly high of 1.3992 so far.
XRP price and volume: under the 90-day value area
Volume gives this XRP price analysis a second map. Across the last 90 daily candles the busiest price band was around 1.4055. About 70% of the volume traded between 1.3074 and 1.5572, the value area. XRP is trading under the bottom of it.
XRP is under the value area, so most of the recent trading happened at higher prices. A bounce to 1.3074 walks back into that zone, and 1.3189 sits just inside it. It doesn’t say which way price goes next. It shows where the trading has been.
XRP price analysis and perpetual positioning: a thinner futures book
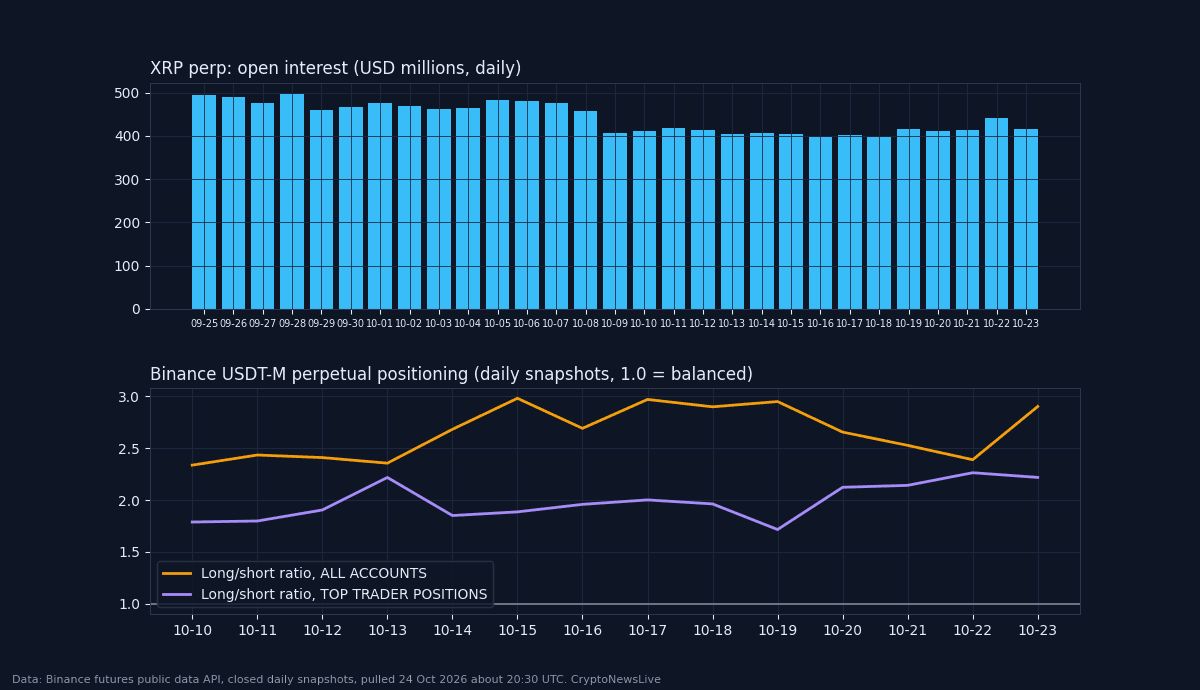
Positioning adds context to the XRP price analysis without adding a verdict. Binance’s XRPUSDT perpetual had $415.6 million of open interest in the Friday 23 October daily snapshot. The highest of the last 30 snapshots was $497.6 million on Monday 28 September. Between the 8 and 9 October snapshots it fell $48.9 million, from $456.5 million to $407.6 million.
The long/short ratio across all accounts was 2.90 on 23 October, so about 2.9 accounts held longs for every one holding shorts. Among top traders by position size it was 2.22. Funding printed +0.0100% at 16:00 UTC on Friday and at 00:00 UTC on Saturday. It turned slightly negative after that, -0.0012% at 08:00 and -0.0030% at 16:00 UTC on Saturday. These are snapshots, true when pulled and not for long.
For a closer look at how leverage has shrunk on this pair, see our piece on the XRP estimated leverage ratio. We also covered the same kind of setup in the Dogecoin price analysis this week.
Bitcoin, sentiment and the XRP price regime
Bitcoin traded at 80,532 on Binance as of 20:00 UTC on Saturday, above its rising 100-day average near 75,293. XRP’s daily returns track Bitcoin’s closely. The correlation is 0.96 over 7 days, 0.85 over 30 and 0.89 over 90, based on Binance daily closes. The Crypto Fear and Greed Index read 51 (Neutral) on 24 October, according to alternative.me.
The regime line for this XRP price analysis: Bitcoin is above its rising 100-day average, while XRP is inside its range, 15.5% under its 20-day high and 3.0% over its 10-day low.
What’s on the calendar
Two dates sit on the XRP price analysis calendar before the month ends. Ripple’s Swell conference runs Tuesday 27 to Thursday 29 October at The Shed in New York. According to the official Swell site, Tuesday is the Institutional Summit, and the main stage days are Wednesday and Thursday. The Federal Reserve calendar lists an FOMC meeting on 27 and 28 October.
On the chart side, the weekly candle closes at 00:00 UTC on Monday 26 October. The October monthly candle closes at 00:00 UTC on Sunday 1 November. Where those closes land, relative to the 1.2930 area, will be easy to check.
XRP price analysis: two scenarios and the levels that decide them
Up scenario. A 4-hour close above 1.3189 (the level swept three times in October) would take price back over the broken swing low and into the value area. That opens 1.3307, the Friday 23 October swing high, and then 1.3465, the equal 4-hour highs. The scenario is cancelled by a 4-hour close back below 1.2954.
Down scenario. A 4-hour close below 1.2562 (the 18 October low and the prior week’s low) would open 1.2468, the 16 September swing low, and then the 0.786 Fibonacci line at 1.1300. The scenario is cancelled by a 4-hour close back above 1.2865.
Which one does the evidence favor? It splits. XRP’s own chart, with four lower highs and price under the 20, 50 and 200-day averages and the value area, points down. Bitcoin’s regime and the three sweeps and recoveries of October point up. Until one 4-hour close settles it, the read is balanced.
This XRP price analysis is market analysis, not investment advice. Levels can fail, and price can close on the far side of either cancel line within hours.