The phrase “the bottom is in” has spread across crypto social media this week. Bitcoin trading near $80,874 has given holders some confidence after months of sustained pressure. But CryptoQuant data published May 5 paints a more disciplined picture, one where the narrative runs well ahead of what on-chain numbers are actually showing.
Three separate cohorts of Bitcoin holders are sitting at a loss right now, each group forming a distinct price band above current spot. Their break-even prices stack directly overhead. That is not a recovery setup. That is a ceiling with three separate floors.
Three Trapped Cohorts, One Big Problem
The 3-to-6-month realized price band sits at $88,879. Holders in this group bought between roughly November 2025 and February 2026, right through Bitcoin’s peak and early decline. Every rally into the $85,000 to $88,000 range walks straight into their exit zone. They are not holding for further gains. They are waiting to get out flat.
Above that sits the 12-to-18-month cohort with a realized price of $93,446. Then the heaviest band of all, the 6-to-12-month holders, carry a realized price at $111,851. That last figure sits 29% above where Bitcoin trades today, according to CryptoQuant’s QuickTake analysis.
So the question is not whether Bitcoin can bounce. It already has. The question is whether it can clear $88,879 and hold it. Not wick through it. Not retest and fail. That is the first real gate for any Bitcoin bottom confirmed signal.
CryptoQuant’s note is direct about what this means:
“Bottom calls are narratives. 88.88K reclaimed and held is data. We’re not there yet.”
Until that level prints as confirmed support, every rally into the mid-$80,000s is running into distribution pressure from buyers who simply want their money back.
What the Wave Count Is Showing
On the technical side, the picture carries its own complexity. Crypto analyst More Crypto Online posted on X a revised micro-structure reading on the 15-minute BTCUSD chart. The reading shows a three-wave pullback from recent highs, with Bitcoin still holding what the account describes as upper support.
“I have slightly adjusted the micro structures, but the key levels have not changed. So far this is a 3-wave pullback and Bitcoin is still holding upper support. Below the $80,481 level the focus will shift to the last swing low at $78,220 as next line of support.”
The chart from More Crypto Online maps Fibonacci retracement levels across the current corrective structure. The 38.2% retracement sits at $81,025 and the 50% level lands at $80,481. That second figure lines up almost exactly with the threshold flagged as the wave structure decision point.
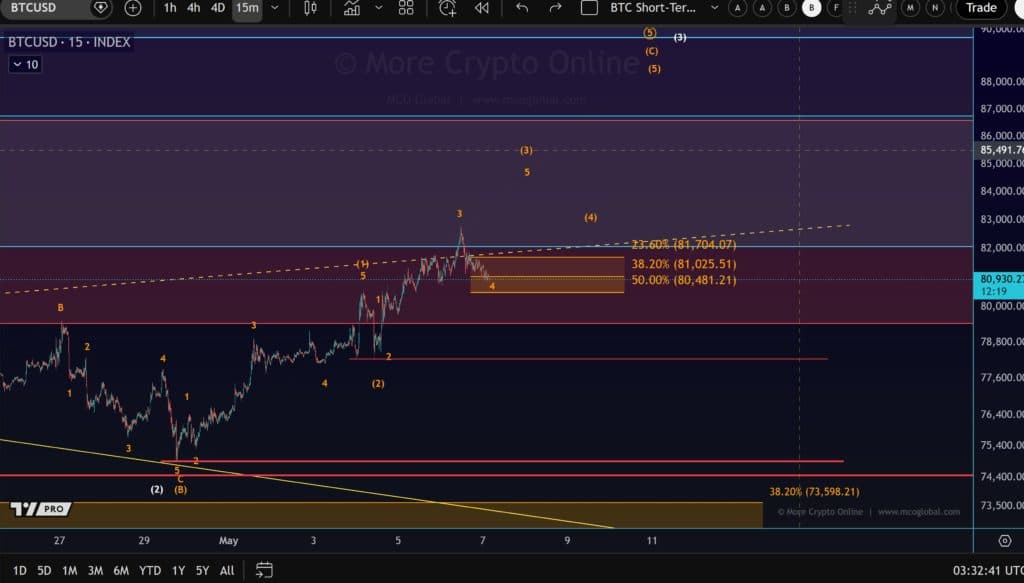
A break below $80,481 does not kill the broader setup. But it does redirect attention toward $78,220, the last meaningful swing low visible on the chart.
Right now Bitcoin is threading between these levels. The wave count suggests the three-wave correction could be complete or close to it. That is a conditional read, not a confirmed one.
The Realized Price Chart Reframes Everything
The CryptoQuant UTXO age band chart shared on X by @IT_TECH_PL provides the longer-term context. It maps realized prices across multiple holding periods going back to January 2020. In the current snapshot dated May 5, 2026, Bitcoin spot price at $80,874 sits below all three key realized price lines being tracked.
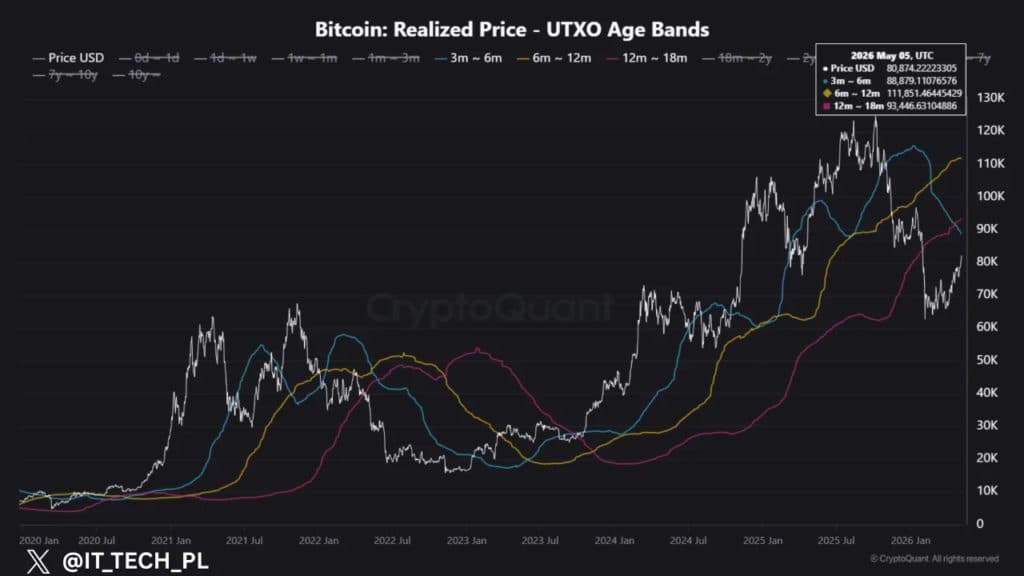
What stands out is not just where these bands are right now. It is how they behaved during prior cycles. Through 2020 and into 2021, spot price ran above the 3-to-6-month and 6-to-12-month bands for extended stretches. That is what a confirmed bull trend looks like inside this data set. Right now price sits under all three lines at once.
The 6-to-12-month band at $111,851 is the one that demands the most patience. Buyers in that cohort purchased during the peak run-up and are sitting on deep unrealized losses. That group does not flip to sellers all at once. But as price eventually approaches their cost basis, pressure builds. That wall is not the immediate problem. The immediate problem is $88,879.
Bitcoin bottom confirmed in on-chain terms means one thing specifically. Price clears and holds above the first realized price band at $88,879. Without that print, the current range is still inside a distribution zone on the data, not a recovery.
The three-wave structure flagged by More Crypto Online could support a near-term push higher. The Elliott count points toward a resumption of upward movement if current support holds. But that move still needs to get through $88,879 and stay there before CryptoQuant’s data changes its verdict.
Two separate tools, two different timeframes, same basic conclusion. The work is not done yet.
Disclaimer: This article is for informational purposes only and does not constitute financial or investment advice. Cryptocurrency markets are highly volatile. Always conduct your own research before making any investment decisions.