Bitcoin dropped from $73,788 to $71,170 on April 12, a 3.55% decline that on-chain data ties directly to the unwinding of an overleveraged futures position buildup. The move was not random. It exposed the structural weakness underneath the prior eight days of price gains.
Open Interest across all exchanges had been rising in near-perfect lockstep with price since early April. That parallel movement, visible on CryptoQuant’s Open Interest data, is what Carmelo Alemán, on-chain analyst and verified CryptoQuant contributor, flagged as the problem.
Futures Built the Rally, Then Tore It Down
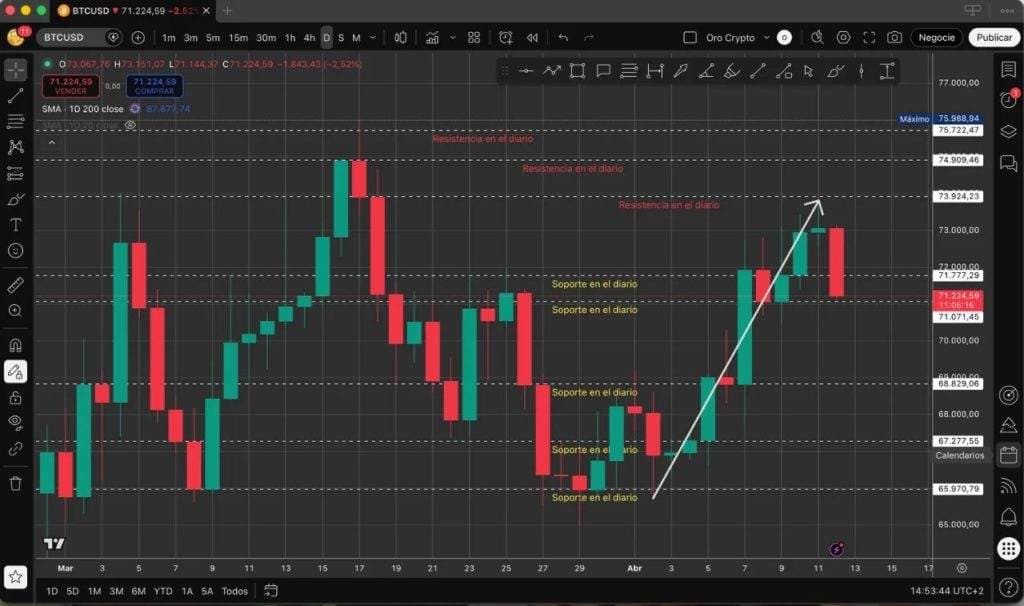
The TradingView price chart was reproducing virtually the same structure as Open Interest over the eight-day run-up, according to Alemán’s CryptoQuant analysis. When two metrics move together that closely, the interpretation is straightforward: the price growth was leverage-driven, not backed by real spot buying pressure.
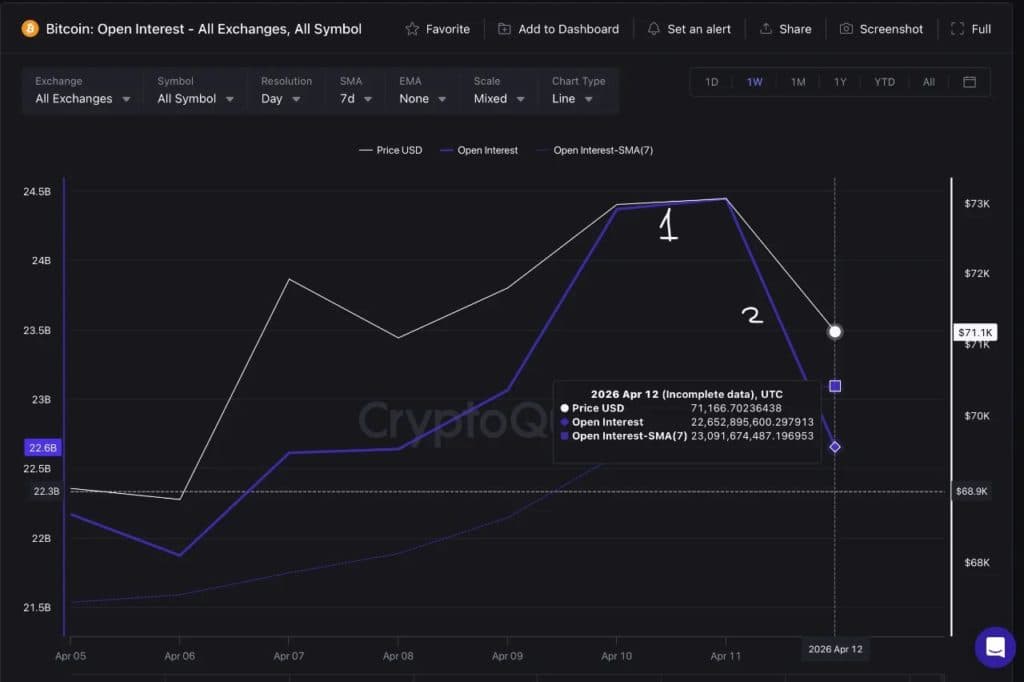
By April 11, momentum was already slowing. Open Interest started losing expansion speed before the price break even happened, which made the April 12 drop more of a confirmation than a surprise. The break came through a dominant bearish candle that invalidated the last key candle of the bullish structure, technically closing out that trend.
“The market is now exposed to a bearish or corrective phase, with a probable retracement toward the initial impulse area,” Alemán wrote on X via @oro_crypto.
Without spot demand absorbing the selling, any bounce from here carries the same fragile base. Alemán’s view is that a rebound built on renewed futures activity alone would not hold.
Power Law Model Flashes a Different Signal
While the short-term structure looks bearish, a separate long-term valuation framework is sending a different reading. On-chain researcher @Darkfost_Coc noted on X that Bitcoin has now dropped below the 20th quantile of the Porkopolis Power Law model, hosted on checkonchain.com.
The current quantile reading sits at 18.5%. That number reflects how rarely BTC has traded this low relative to its long-term power law growth path. Out of Bitcoin’s entire price history, only 18.5% of the time has it traded at or below this distribution level.
Historically, readings below 20 have shown up during bear market bottoms and capitulation phases. The 2018-2019 bear market tested these zones before a multi-month recovery. So did the 2022 cycle bottom.
As @Darkfost_Coc posted on X: “We are now approaching extreme undervaluation levels.”
The model is explicitly long-term. It does not call short-term price direction. But for holders measuring risk versus reward over months or years, an 18.5% quantile reading has historically represented one of the more skewed setups in Bitcoin’s favor.
Two Readings, One Asset
The tension between both signals is real. Short-term structure, confirmed by Alemán’s Open Interest breakdown, points to continued downside or at minimum a shaky base for any recovery. The long-term power law model, as flagged by Darkfost, says the asset is statistically cheap by historical standards.
What ties them together is the absence of organic spot demand. If buyers step in with real conviction at these levels, the power law thesis has a path to play out. If not, the retracement Alemán pointed to toward the initial impulse area remains the more likely near-term trajectory.
The April 12 drop removed any ambiguity about what drove the prior rally. Futures built it. Futures unwound it.