Bitcoin broke below its rising price channel. Then it bounced back to the exact level that broke it.
That kind of price action does not resolve cleanly. What looked like a support floor has now flipped into a potential ceiling, and the data from three separate sources points to the same zone as the line in the sand.
Broken Channel, Clean Backtest
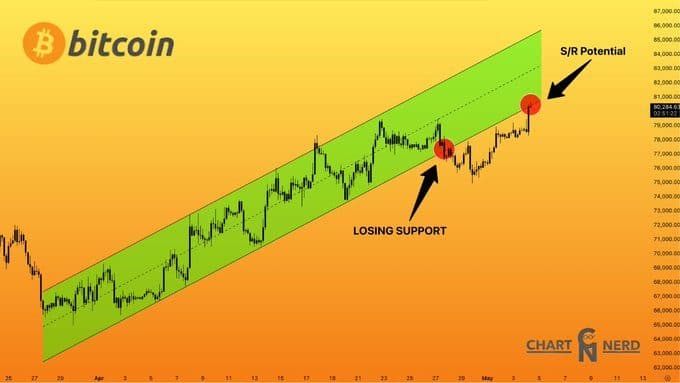
According to ChartNerdTA on X, Bitcoin lost its uptrend channel support before rallying back toward $80,000. The chart shows price has since climbed back to test that broken lower boundary from beneath.
“Bitcoin lost its uptrend support and has since rallied to $80K. In the process it’s now evident we confirming a backtest on the previous uptrend channel support as potential resistance. The potential to create an S/R remains high here. Just a contrarian viewpoint,” ChartNerdTA posted on X.
That support-to-resistance conversion is not a minor footnote. When price breaks below a trendline and then climbs back up to it, the old floor becomes a ceiling. Sellers who were trapped during the breakdown tend to exit positions near their entry. That supply pressure is what turns former support into resistance.
The $80K zone now carries that overhead weight.
Where ETF Buyers Actually Entered
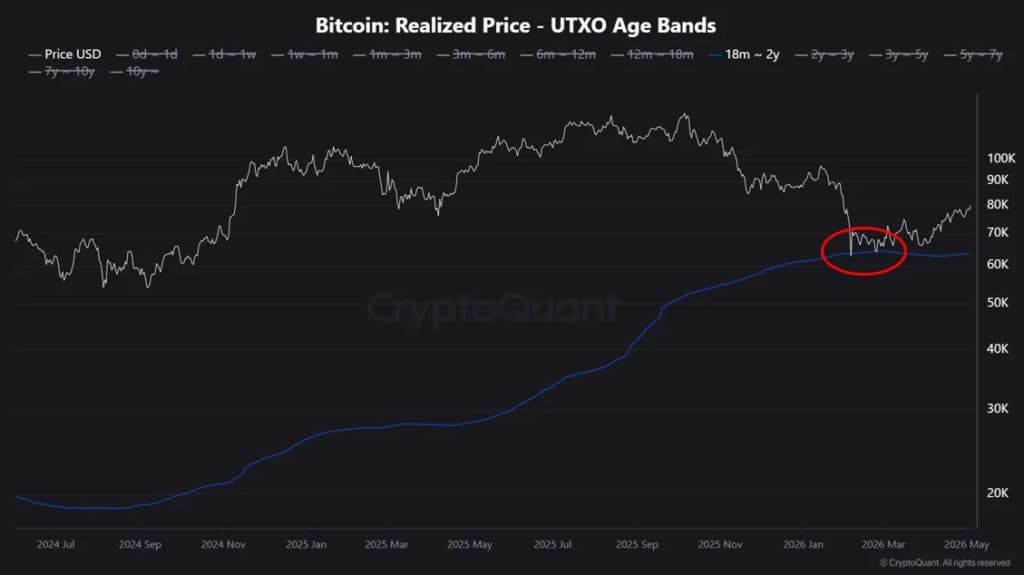
The bounce off recent lows did not happen in a vacuum. CryptoQuant data shows that the average cost basis of investors who entered following the initial spot ETF approval is now acting as a key support level, and a rebound has emerged directly from that zone.
What makes this structurally different from prior cycles is the scale of institutional capital sitting at these levels. The funds that moved in during the early ETF phase were largely institutional rather than retail. Those positions do not panic the same way. CryptoQuant analyst crypto-dan noted the current downtrend may play out differently than past cycles, precisely because that variable did not exist before.
The UTXO age band chart from CryptoQuant shows the 18-month to 2-year cohort’s realized price sitting near the $65,000-$67,000 range, while the bounce in early 2026 came from price touching that ETF buyers’ cost basis band, visible in the red-circled area on the chart. Bitcoin has since recovered toward $80K from that zone.
The Liquidity Stack at $80,258
Darkfost on X shared the Coinglass BTC liquidity heatmap, where the yellow bands marking the heaviest order clusters sit at $80,258 and $78,587. Those bright horizontal lines represent areas where large limit orders have built up over the two-week lookback period.
“$BTC is saying hello to shorters this morning,” Darkfost posted on X.
Price is currently pressing into that $80,258 cluster from below. Dense liquidity at a resistance level does one of two things: it either absorbs buying pressure and caps the rally, or it gets swept in a short squeeze that accelerates price through it. Neither outcome is neutral.
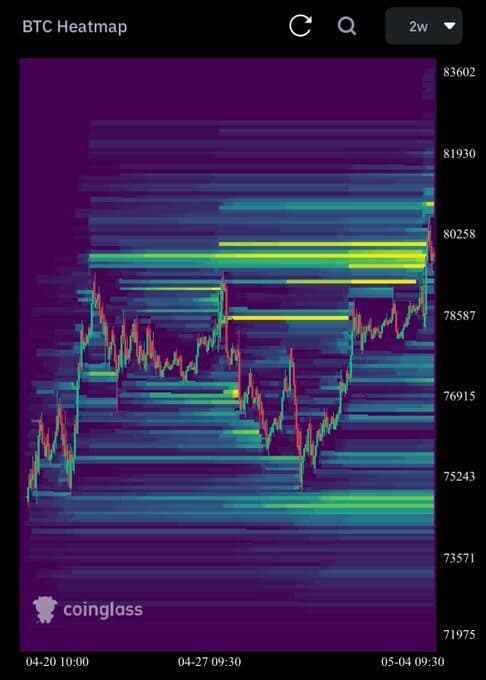
The Coinglass heatmap shows a secondary cluster near $75,243 below current price. That would be the next meaningful zone if buyers fail to hold the $80K test.
What Happens From Here
CryptoQuant’s crypto-dan noted that accumulating during significant corrections may prove to be a sound approach, and that monitoring the depth of any pullback following this rebound will be the key near-term signal to watch.
The three data points converge on the same conclusion. Bitcoin is sitting at a backtest of broken uptrend support, pressing into a dense liquidity cluster, and doing it from a base that is the average cost of the largest institutional cohort to ever enter this asset class. The next move from $80,258 will carry more information than most.