Bitcoin’s on-chain data is showing the first clear shift in seller behavior since the start of the year. The 7-day moving average realized profit/loss ratio has climbed to 2.9, according to CryptoQuant data shared by on-chain researcher Darkfost on X. That means realized profits on BTC are now more than twice the size of realized losses.
It is the first time this reading has been in positive territory since January 2026. Losses had been the dominant story from that point through most of the period that followed.
Profit Flip Does Not Mean the All-Clear
The ratio moving above 1 matters. When BTC holders are booking gains instead of cutting losses, it typically signals returning confidence and steadier price behavior. But Darkfost, posting on X, was measured in the assessment.
“For now, this remains a relatively modest ratio, but it is still a constructive development.”
The 2.9 reading sits well below the threshold that historically triggers distribution pressure. According to Darkfost on X, once the profit/loss ratio climbs above 20, realized profits become too heavy for the market to absorb and a distribution phase tends to follow. At current levels, that scenario is not in view.
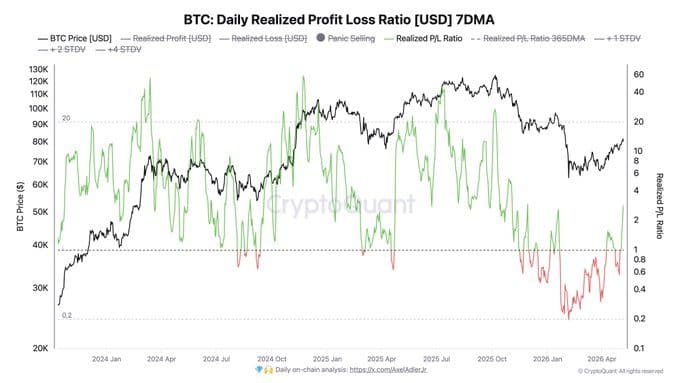
The CryptoQuant chart covering BTC’s daily realized profit/loss 7DMA confirms the reading. The green ratio line, which had been pressing into negative territory through much of early 2026, has ticked back upward. It is not a dramatic reversal but it is a measurable change.
The Chart Problem at $80K
The on-chain improvement is happening at the same time a technical structure is under pressure. Technical analyst ChartNerdTA flagged a parallel channel breakdown on the 4-hour BTC chart, posting the analysis on X.
Support for that channel has been lost. What was once a floor is now behaving like a ceiling, a support-to-resistance flip that ChartNerdTA described as not yet confirmed but showing early signs.
“Defending $80K and reclaiming the channel would target a move toward $84K. Failure to hold 80K would open the door to the mid-70’s region at a minimum.”
The Fibonacci levels are central to what happens next. The 0.382 and 0.5 retracement zones, sitting near $79,511 and $75,376 respectively per the chart, are holding as demand reference points. A clean sweep below both would shift the probability toward a trend reversal, ChartNerdTA noted on X.
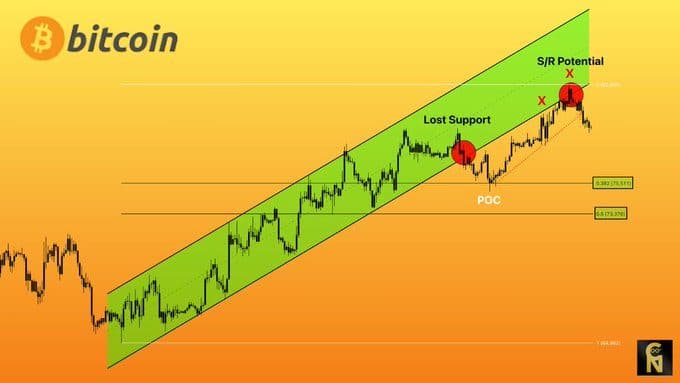
The $75K to $80K range is now the zone doing most of the work. Bulls need $80K back. Bears need that level to hold as resistance.
Two Signals, One Decision Point
The tension here is real. The on-chain data points to recovering confidence. The 4-hour chart points to a structure that lost its footing and has not reclaimed it. Both of these things are true at the same time.
Darkfost’s framing on X captures the balance:
“A market where profits are being realized is not unhealthy, quite the opposite.”
But realized profits returning does not guarantee price follows. It tells us sellers are no longer capitulating at a loss, not that buyers have taken full control. For BTC holders watching the $80K level, the on-chain shift is relevant context. Whether it becomes a catalyst depends on what price does with the channel.
CryptoQuant data also shows short-term holders, those who acquired BTC between one and three months ago, are sitting on their highest unrealized profit margins since June 2025, according to reporting from CryptoTimes this week. That cohort becomes a selling pressure risk as price climbs. The $80K to $82K band was already flagged as a distribution zone by multiple technical setups.
The next directional move, whether toward $84K or back to the mid-$70Ks, is likely to be decided at exactly the level where these two signals collide.
Disclaimer: This article is for informational purposes only and does not constitute financial or investment advice. Cryptocurrency trading involves significant risk. Always conduct your own research before making any investment decisions.