Bitcoin posted a 4.05% gain on April 23, moving from $76,351 to $79,447. The numbers look clean on the surface. They are not.
On-chain data from CryptoQuant tells a different story. The rally was not pulled up by consistent buying in spot markets. It was pushed by a derivatives market under severe pressure, and the exit was violent.
The Numbers Behind the Squeeze
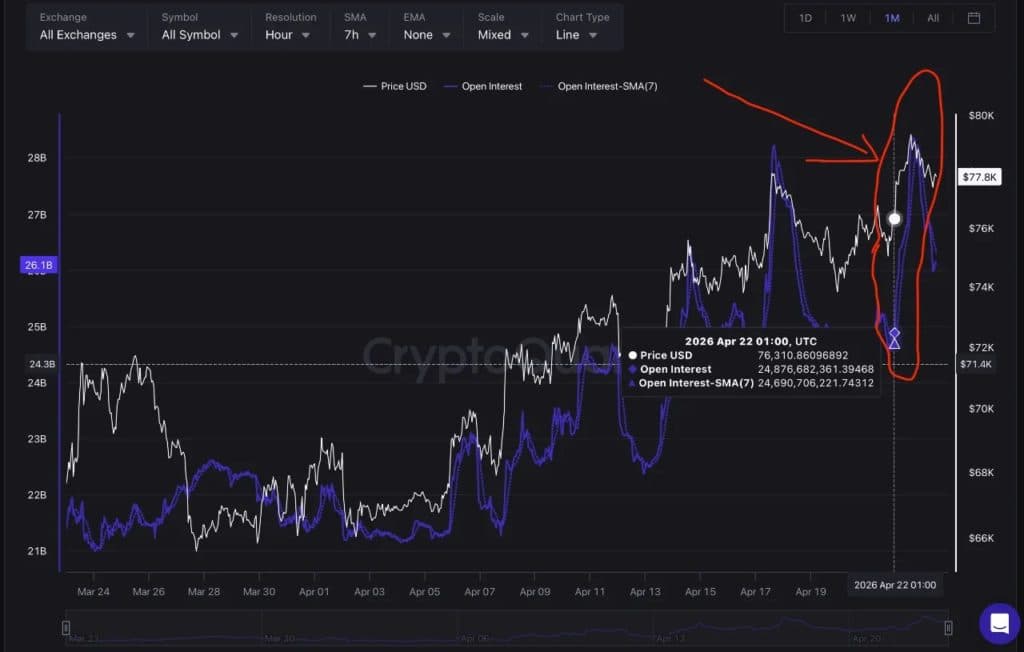
Open interest went from roughly $24.88 billion to about $28B during the price leg up. That acceleration did not happen because new long positions were piling in from conviction. It happened because short sellers were forced to close, and closing shorts means buying back the asset.
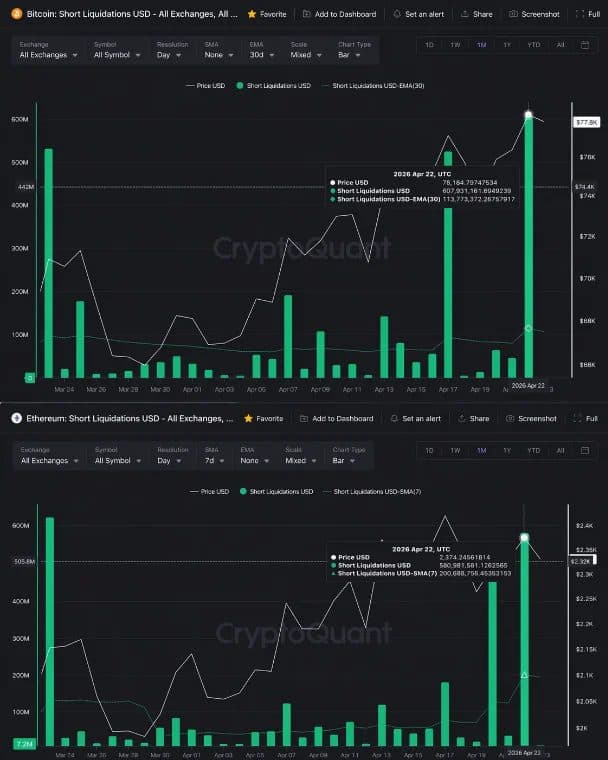
Bitcoin short liquidations on April 22 came in at $607,931,161.69, per CryptoQuant data. Ethereum ran nearly parallel, with $580,981,581.13 in short liquidations on the same day. Combined, that is $1,188,912,742.82 wiped from one side of the trade. Just over $1.19 billion.
The long side? Far smaller damage. BTC long liquidations totaled $12,836,598.42. Ethereum showed a bigger number, $98,526,338.05, but even combined the total long liquidations reached $111,362,936.47. The ratio tells the story: shorts lost roughly ten times more than longs in a single session.
What Carmelo Alemán Said on X
Carmelo Alemán, on-chain analyst at CryptoQuant, posted the breakdown on X. He was direct about the implication.
“As long as price depends more on derivatives than on solid spot validation, the structure will remain vulnerable to reversal.”
That line matters because it shifts the question. The move happened. But what made it happen also tells you how stable it is. Futures leverage forced the squeeze. Spot demand did not lead it.
Alemán’s read, posted via @oro_crypto on X, frames the rally as a structural artifact. Not a rejection of bearish positioning, just a forced unwind of one side. That is different.
The Spot Validation Problem
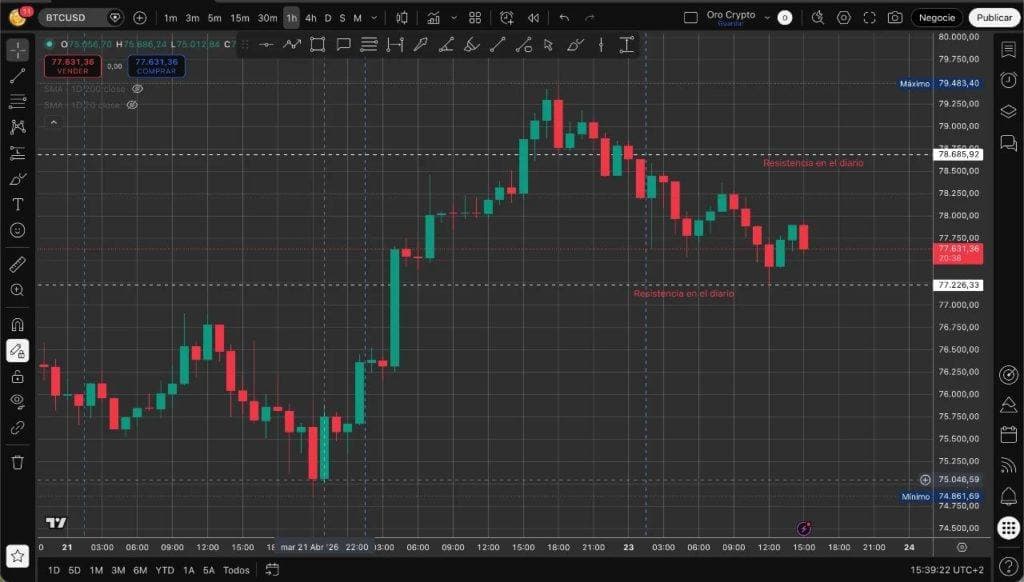
Bitcoin hit $79,483 during the run, per TradingView data. Then it faded. Hourly resistance levels at $78,685 and $77,226 held as ceilings after the squeeze exhausted itself. That rejection happened fast.
The reason fits Alemán’s thesis. A spot-led rally builds slowly and holds resistance. A derivatives-driven squeeze hits hard and then stalls when the forced buying ends. The OI spike to $28 billion, followed by a sharp collapse in open interest while price stayed elevated, is exactly the footprint that thesis predicts.
Ethereum Felt It Too
Ethereum’s $580.9M in short liquidations came close to matching Bitcoin’s figure. That is unusual. ETH typically runs behind BTC in liquidation scale during cross-market squeezes. The near-parity between the two assets this session points to broad short positioning across both majors, not a Bitcoin-specific trade.
Long liquidations in ETH came in at $98.5 million against $580.9 million in short wipeouts. That ratio alone confirms which side the market was crowded on going into April 23.
The question now is whether spot demand enters behind the squeeze. If it does not, open interest rebuilds on the short side and the structure sets up again. If it does, the move gets confirmed. Right now, the data from CryptoQuant does not confirm that confirmation yet.