Bitcoin’s latest recovery brought in billions through ETFs. It also handed short-term holders the exit door they were waiting for.
On-chain analyst Darkfost, on X, flagged a pattern that ran through three consecutive trading sessions during BTC’s recent climb. STH wallets sent 65,000 BTC, 54,600 BTC, and 39,000 BTC to exchanges across those three days. Nearly 150,000 BTC total. In 72 hours.
The Chart Tells a Specific Story
The CryptoQuant chart attached to Darkfost’s post shows the Bitcoin Short-Term Holder P&L to Exchanges Sum across 24-hour periods, plotted against BTC’s USD price. What stands out is the shape of the outflows, not just the size.
Each of the three highlighted sessions produced a progressively smaller but still unusually large inflow spike. The pink bars representing total STH exchange deposits peaked at the 65,000 BTC session, dropped to 54,600 BTC, then came back at 39,000 BTC in the third session. Price kept moving higher through all three. That divergence tells the story. STHs were selling into the rally, and the volume of each exit wave stayed in ranges well above normal, even as the impulse faded slightly.
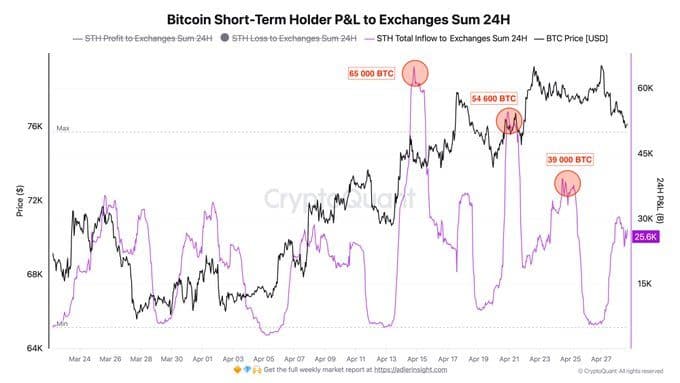
The chart period runs from late March through late April 2026, with BTC trading between $64,000 and around $78,000. The three flagged sessions sit between April 14 and April 21, coinciding with BTC’s push toward the $75,000 to $76,000 range. Each spike appears at or near price highs within that range.
As Darkfost noted on X, STHs “do not appear to have gained enough confidence to continue holding for longer” despite the upward move, with “three particular days” standing out for “especially large movements.”
Why 150K BTC to Exchanges Matters Now
Short-term holders are defined as wallets holding BTC for under 155 days. That cohort includes buyers who entered near recent lows and buyers still underwater from entries above current prices. Both groups hit exchanges for different reasons, and the chart shows both profit-driven and loss-driven flows during the period.
Glassnode on-chain data, cited by CoinDesk on April 24, put STH profit-taking at $4.4 million per hour during the rally. That rate is three times the $1.5 million per hour level that preceded every local top recorded in 2026. The STH average cost basis sits at $80,100, and Glassnode data shows that above that level, more than 54% of recent buyers are statistically positioned to sell.
BTC has not cleared $80,100. So the larger wave of exits has not yet begun.
The BeInCrypto analysis from April 15 added another figure: hourly exchange inflows hit 11,000 BTC when BTC tested $76,000, the highest single reading since late December 2025. The average deposit size jumped to 2.25 BTC that day, the highest daily reading since July 2024, driven by large individual transfers above 1,000 BTC going into Binance.
Exits Running Alongside Record ETF Buying
What makes this period distinct from previous STH selling waves is what is happening on the other side of the trade. U.S. spot Bitcoin ETFs logged eight consecutive days of net inflows through April 23, totaling $2.1 billion, per SoSoValue data. BlackRock’s IBIT absorbed $732.6 million of that in a single week alone.
That institutional buying is absorbing a significant share of what STHs are offloading. CryptoQuant CEO Ki Young Ju put it plainly on X, posting that old whales are selling to new long-term whales, and that institutional adoption is operating at a scale that past cycle models did not account for. The question is whether ETF inflows can keep pace if STH exit volumes stay at the levels Darkfost flagged or climb further as BTC approaches $80,000.
Bitcoin exchange reserves dropped to a seven-year low in late April 2026. Less BTC sitting on exchanges generally reduces liquid sell-side supply. But the three-day window of 150,000 BTC in STH outflows cuts against that structural picture in the near term.
What the Descending Pattern in the Chart Signals
The declining but sustained size of those three spikes carries a specific reading when mapped to price. The largest outflow at 65,000 BTC came first, when BTC was testing resistance near $76,000. The 54,600 BTC session followed as price consolidated briefly. The 39,000 BTC session arrived as BTC attempted another push higher.
That pattern is not capitulation. Capitulation involves selling into falling prices. This is the opposite: structured exits at resistance. Each wave was smaller, which could read as exhausting sell pressure. But the absolute volumes remain high enough that a fresh run at $80,000 or above would likely produce another spike, given that most STH cost basis remains below current prices for buyers who entered in the $60,000 to $72,000 range.
Darkfost described the cohort as “highly fragile” on X, writing that STHs “remain highly fragile and are still quick to exit the market whenever an opportunity presents itself.”
The chart now shows the 24-hour STH inflow sum falling back toward 25,600 BTC as of late April, well below the three flagged sessions. Selling pressure from this cohort has pulled back. Whether it stays down as BTC tests the $78,100 to $80,100 zone is where this story heads next.