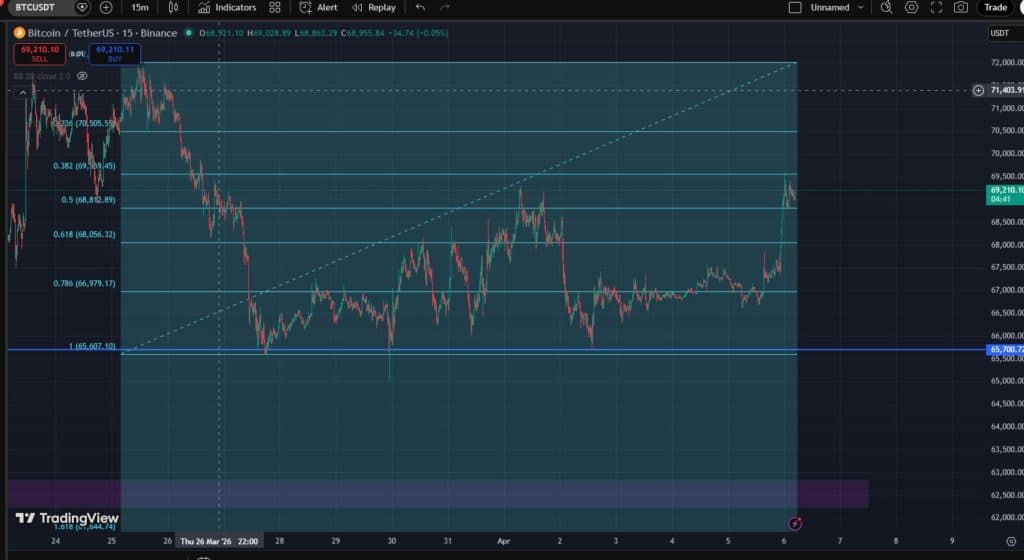
Bitcoin posted a 2.58% gain late Sunday, clearing overhead resistance and pushing back inside the daily TBO cloud. Price touched $69,588 intraday. On the 15-minute chart, that move carried straight into the 0.382 Fibonacci retracement level at $69,359 and stalled.
The push looked clean on price action alone. But the volume behind it told a different story entirely.
Volume Drying Up While Price Climbs
As Aaron Dishner, known on X as @MooninPapa, said in a post on X, on-balance volume is clearly trending bearish. Not just OBV but raw weekend volume too, with the moving average declining steadily week over week.
“Never ever, NEVER EVER, ever trust a Sunday pump. It’s a hugely manipulatable period of low liquidity for exchanges.”
Weekly volume has been contracting since the week of March 9. When volume dries up this way, what typically follows is a sharp capitulation dump rather than sustained continuation, MooninPapa noted on X. The TBT stop-loss hunting alerts have been firing repeatedly since April 4, pointing to irregular price action rather than directional strength.
The 15-minute Fibonacci setup placed last Friday captured the move almost exactly. Entry at the 0.618 retracement level at $68,056 triggered after the candle closed inside that zone. Price climbed through the 0.5 mid-range at $68,812 then pressed directly into the 0.382 level at $69,359. Candles hit that zone and began retracing. The scalp exit held.
ETH, Stablecoins, and the Bigger Picture
Ethereum is holding inside the daily TBO cloud, still in bullish consolidation. But RSI has not broken the prior local high from April 1st. MooninPapa, in a post on X, said he still expects ETH to drop toward $1,000 given how overbought RSI was back on March 16th.
Stablecoin dominance has not put in a higher high yet. Others dominance dropped hard on the BTC pump Sunday before returning to bearish consolidation. TOTALES pushed back inside the cloud, confirmed closed inside it, now sitting in bullish consolidation mode.
The macro trend has not changed, according to MooninPapa on X. BTC is back inside the cloud but on manipulation and thin liquidity. The weekly chart shows no structural shift in volume.
TradFi Pressure Points
The U.S. dollar index bounced back above overhead resistance despite a TBT bearish divergence signal. USD/JPY is pressing TBO resistance at 149 again. Three TBT bearish divergence clusters now sit in a tight group on the weekly chart. That tension has to resolve eventually.
S&P futures printed a bullish RSI reset. TBO support moved up from 5,049 to 6,353, a setup that matches patterns from April 2025 and October 2023, possibly marking a pivot low. On-balance volume on the S&P remains heavily bearish though.
Oil is strong. UK Oil and WTI both pushed higher, with UK Oil up roughly 9% on Thursday. Gold opened lower with OBV turning bearish for the first time in recent weeks. Silver stays in bearish consolidation. MooninPapa noted on X that uncertainty around the Iran energy situation is feeding volatility across markets, including Sunday’s Bitcoin move.
Individual Picks Snapshot
MU is holding above the TBO cloud after a 62% run from the March 16th long signal, but RSI is likely at a pivot high. ALGO had a massive week with RSI hitting 90.64 and the move is probably exhausted. RENDER is forming a wedge with bullish OBV and could still push higher.
$STX is showing three TBO breakdowns. A failure at current support puts a 64% drop risk on the table. $HYPE has closed its TBO long and is playing out the expected bounce-then-drop sequence. $FET is one to watch for a bearish OBV cross. $BCH printed a TBO breakdown. $WLD continues making lower lows.
The Bitcoin Sunday pump reached the exact Fibonacci target at the 0.382 level. Whether it extends or fails there depends on whether volume shows up. So far, it has not.