Bitcoin crossed $81,000 this week, adding roughly 36% from the February 6 low. The move pushed Bitcoin dominance above 61.3%, a level not seen since November 2025. Capital is still heavily concentrated in BTC, but a separate set of data out of CryptoQuant is starting to tell a different story for altcoins.
Not a breakout. Not yet. But the numbers are shifting.
Altcoin Volume Quietly Climbs Back
According to Darkfost_Coc on X, altcoins have been under pressure for most of this period. TOTAL3, the combined altcoin market cap excluding BTC and ETH, is still up around 15% from the same February 6 starting point. That lag compared to Bitcoin’s 36% says a lot about where money has been sitting.
The more telling figure is volume. Altcoins’ share of trading volume on Binance, measured against combined BTC and ETH volumes, moved from 31% to 49% across the past two months. That shift is visible in the CryptoQuant dominance-by-volume chart.
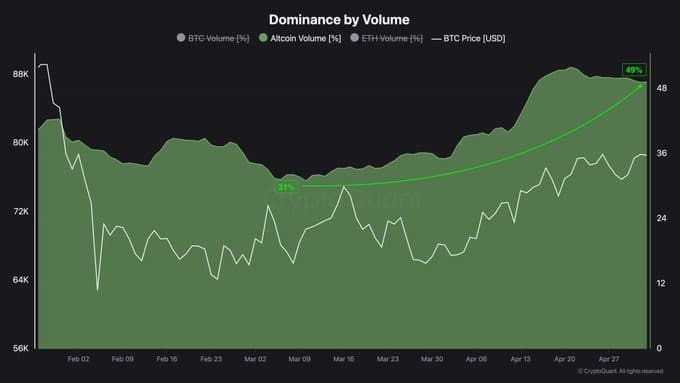
The green band representing altcoin volume share has climbed steadily from its February floor, reaching 49% by late April. BTC price, shown as the white line, has tracked upward alongside it, but the volume story is now running on a separate track.
“These elements suggest that altcoins are starting to attract flows again, although the trend remains moderate for now. Still, this is a development worth monitoring, as this type of shift can precede a more pronounced rotation phase within the market,” as Darkfost_Coc posted on X.
200-Day MA Data Shows a Floor Forming
The second chart, tracking the percentage of Binance-listed altcoins trading above their 200-day simple moving average, shows the same early turn. As of now, 11.7% of altcoins on Binance have reclaimed that level. Back on February 6, only 2.3% were above it.
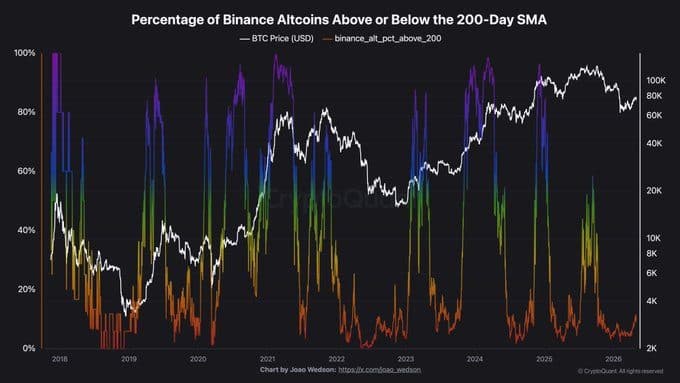
That reading is still low by historical standards. Looking at the full chart going back to 2018, prior altcoin season peaks have seen this figure push above 60% and even 80%. The current 11.7% is nowhere near those levels. But the direction matters. This is the first uptick after a downtrend running since October 2025, when the percentage started falling from highs above 60%.
The chart, produced by Joao Wedson and shared via CryptoQuant data, also plots BTC price against the altcoin 200-day SMA breadth going back to 2018. Each time the breadth metric bottomed and turned up while BTC price was rising, it marked either the start of a broader recovery or at minimum a pause in altcoin deterioration. The current setup fits that pattern, though prior episodes also saw false starts.
As Darkfost_Coc noted on X, the improvement in the 200-day MA recovery rate “breaks the downtrend in place since October 2025, marking an initial signal of recovery.”
BTC Dominance Is Not Pulling Back Yet
Bitcoin dominance sitting above 61.3% tells its own story. That level has not been touched since November 2025, which was a period of heavy BTC accumulation before the market’s last peak. The Binance volume data confirms it. BTC’s volume share has been dominant throughout the February to April window, even as altcoin share climbed from 31% back to 49%.
The two charts together suggest something specific. Altcoin volume is recovering as a share of total Binance trading. But BTC dominance by market cap has not dropped. That means money is moving into altcoins without Bitcoin losing ground in relative terms. Both can rise together in early rotation phases before BTC dominance eventually starts to compress.
That compression has not started. CryptoQuant data shows no clear rollover in BTC dominance as of the latest update.
What the Numbers Actually Say
The altcoin 200-day SMA breadth reading of 11.7% sits at historically depressed levels. In February 2019, a similar low was followed by a multi-month recovery that eventually pushed the breadth metric above 80%. In mid-2020, a low reading in the same range preceded the late 2020 and early 2021 cycle. Neither precedent is a guarantee. Both took months to develop.
What’s different this cycle, as the chart by Joao Wedson shows, is that the recovery from this low has been slow compared to prior episodes. Volume is returning, per the dominance-by-volume data. But the 200-day SMA breadth is climbing at a gradual pace, not the sharp reversals seen in 2019 or 2020.
For retail holders in emerging markets, particularly those watching mid-cap altcoins on Binance, the 49% volume share recovery is the more immediate signal. It points to renewed trading activity in altcoins without requiring a full altcoin season thesis to hold.
DISCLAIMER: This article is for informational purposes only and does not constitute financial or investment advice. Cryptocurrency markets are highly volatile. Always conduct your own research before making any investment decisions.