Cardano is sitting at $0.264 right now. That number might not look exciting. But on the monthly chart, it is sitting directly on a floor that has done something very specific, twice before.
The $0.25 level. It held in January 2023. It held again in September 2023. Both times, what came after was not a small bounce.
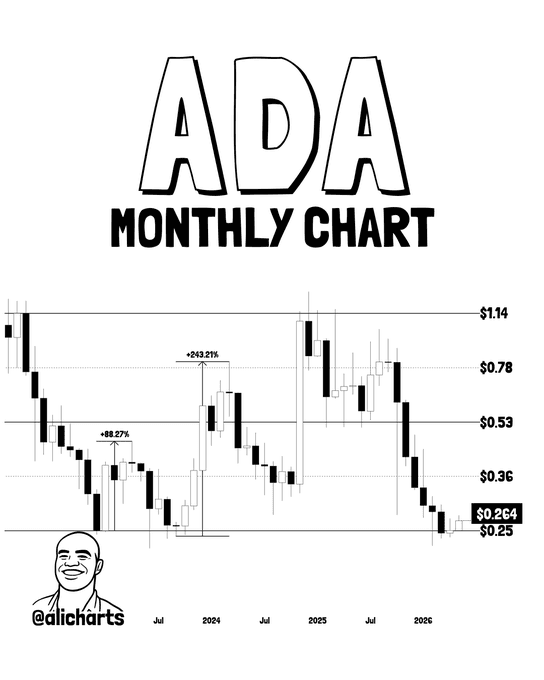
According to alicharts on X, the January 2023 touch of $0.25 triggered an 88.27% rally in the weeks that followed. The September 2023 retest of that same level led to a surge that eventually reached 243%. Those are not estimates. They are marked directly on the monthly candle chart shared in the post.
Two Bounces. Same Floor.
The monthly chart shows ADA trading near $0.264, with the $0.25 zone sitting just below as a defined structural support. As alicharts posted on X, the pattern at this floor has now repeated three times, with the current price action matching the same setup seen in those two prior instances.
“Today, Cardano is bouncing off this $0.25 support once again. To me, this suggests a major structural rally could be brewing.”
The first bounce off $0.25, in early 2023, came after a brutal sell-off from ADA’s all-time high territory. The second, in September 2023, arrived during a similarly compressed period where ADA had been stuck in a narrow range for months. Both cases saw the price hold and then move sharply higher.
What the chart does not show is any guarantee. It shows a pattern. Three touches of the same support, two of which launched significant moves upward.
What the Targets Look Like
Alicharts on X identified two price targets based on the current setup. The first is $0.36, described as the initial recovery level. The second, a macro target, sits at $0.53.
The $0.36 level would represent roughly a 36% gain from current prices near $0.264. The $0.53 target, if reached, would push ADA close to where it was trading in mid-2024 before the broader altcoin correction picked up pace.
Neither target is a certainty. The analyst was direct about the condition attached to both: ADA must hold $0.25. If that floor gives way, the read on this setup changes completely.
“If we fail to hold $0.25, it would signal a deeper regime change and open the door for a more significant correction,” alicharts stated on X.
That framing is what makes the $0.25 level the number to watch, not $0.36 or $0.53. Those are destinations. $0.25 is the condition.
The Monthly Chart Does Not Lie Often
Monthly charts filter out the noise. Daily and weekly charts can produce false signals from short-term liquidity moves. Monthly support levels tend to take longer to form, and when they break, the moves that follow are usually larger.
ADA’s current price near $0.264 keeps it above that line, at least for now. The month of May 2026 is still open. A close above $0.25 at end of month would confirm the floor held for a third time.
The 243% return from September 2023 bounced from this same zone over several months. It was not a one-week spike. The 88.27% rally from January 2023 also played out across weeks of price action. Anyone watching this setup on shorter timeframes may miss the structural context the monthly view provides.
Volume and broader crypto market conditions will determine how quickly, or if, any move develops. What the monthly chart has done is establish a reference point. Three times at $0.25. Two bounces. The third is in progress.