Ethereum is trading around $2,332 and holding a support zone that, if it breaks, could pull the second-largest cryptocurrency down to levels last seen earlier this year. A bearish reversal pattern has formed on the daily chart. It has not confirmed yet. But the structure is clean, and the descending neckline running underneath it is making it harder to ignore.
On April 26, crypto trader CGT_Trader flagged the setup on X, noting ETH had printed a head and shoulders top with a descending neckline. According to CGT_Trader, on X: “Price just printed a head and shoulders pattern on $ETH with a descending neckline, a sign of particular weakness.”
Neckline Is the Only Number That Matters Now
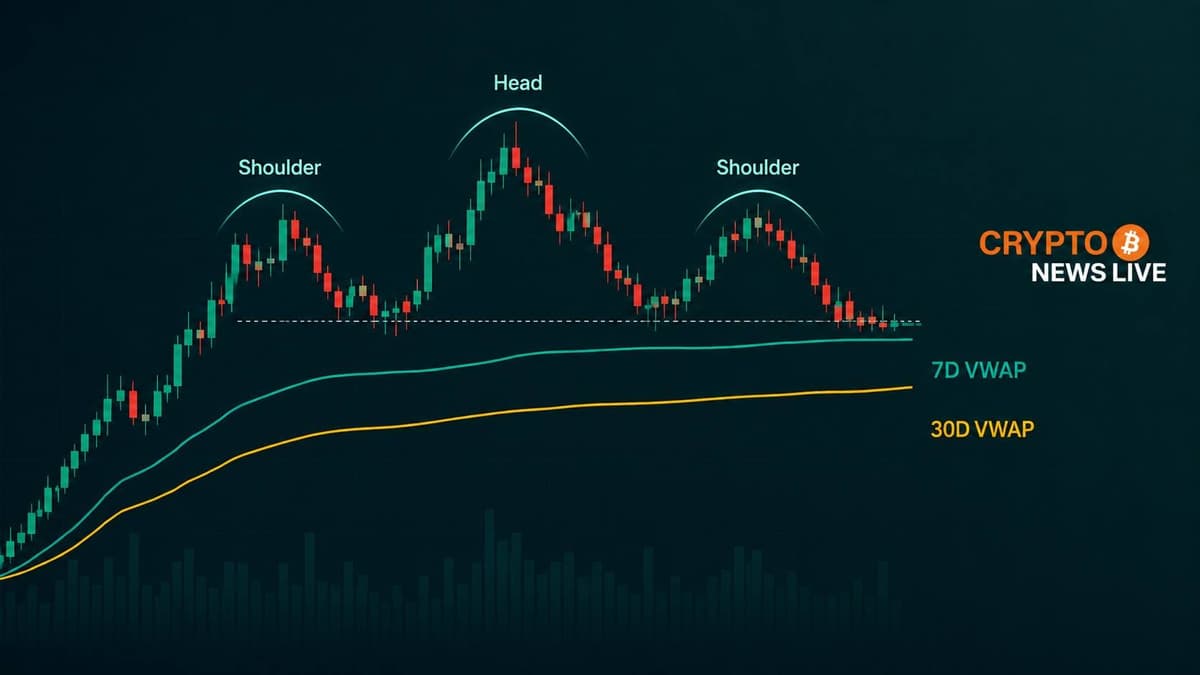
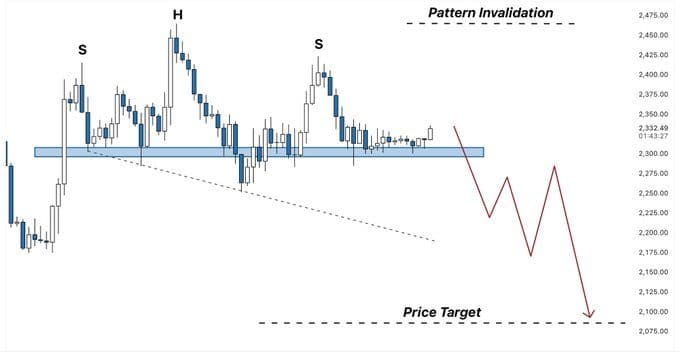
The pattern structure is textbook. A left shoulder formed after an initial rally and pullback. The head peaked in the $2,450 to $2,475 zone. The right shoulder came in lower, roughly symmetric to the left in both time and height. That alone signals weakening buying pressure at each successive high.
Most head and shoulders setups carry a flat neckline. This one slopes downward, sitting between $2,300 and $2,330. That slope tells you buyers defending support are doing so at progressively lower prices. Support is not holding. It is retreating.
CGT_Trader was direct about what needs to happen before this becomes active. As CGT_Trader posted on X: “For confirmation, we need a strong close below the blue box.” Price at $2,332 is sitting right on top of that blue box right now.
ETH Is Already Trailing Bitcoin
The pattern does not exist in isolation. ETH has been underperforming Bitcoin in recent sessions, as noted in replies to CGT_Trader’s post on X. That kind of divergence has historically preceded broader altcoin weakness. When the largest altcoin trails Bitcoin during consolidation, it usually points to ETH-specific selling pressure, not just broader market noise.
The descending neckline adds weight to that reading. Each time price returns to test support, it does so from a lower high. That is eroding structure, not building it. Bulls need to defend this zone or the pattern gains legs.
Where Price Goes if the Break Happens
The measured-move target for a confirmed head and shoulders breakdown is calculated by taking the height from head to neckline, then projecting that distance downward from the break point. CGT_Trader’s chart places that target in the $2,075 to $2,100 zone. The post rounds the key psychological level to $2,000.
As CGT_Trader noted on X: “If this plays out, it could bring price back down to $2,000.”
The $2,000 to $2,100 range is not arbitrary. It is a zone that has already absorbed a major selloff once in 2026. That prior support gives the target added technical credibility if the neckline gives way.
The current pattern has not validated. CGT_Trader was explicit about this too. A daily close back above the head high near $2,460 wipes the setup entirely. Bulls who push price through that level flip the structure back in their favor and likely open a retest of recent highs.
Both outcomes remain live. The next few daily candles around the $2,300 neckline are the decision point. A clean close below opens the door toward $2,000. A rejection and push above $2,460 ends the bearish case entirely.