ETH whale distribution is accelerating. A cohort of mid-tier holders has quietly shed over 3.4 million ETH since October, and spot selling pressure just hit levels that traders have not seen in weeks. The timing lines up badly for anyone expecting a quick push to $3,000.
The price itself is hovering around $2,300 on the hourly chart, largely flat after a choppy few sessions since late April.
Whales Changed Their Behavior in October
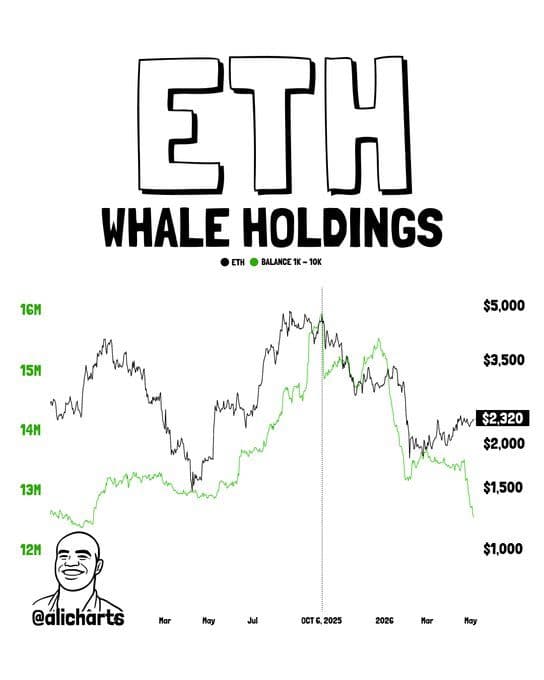
According to alicharts on X, wallets holding between 1,000 and 10,000 ETH went through a significant regime shift in October last year.
“Ethereum whales holding 1,000 to 10,000 $ETH have undergone a significant regime change in their market behavior. Before this shift, this cohort was in a steady accumulation regime.”
Their holdings grew from 12.95 million ETH in April 2025 to a peak of 15.95 million ETH by October 6, 2025. That peak didn’t hold. Since then, the same group has cut their position down to roughly 12.52 million ETH, representing a 21.5% drop. That’s 3.43 million ETH moved out of mid-tier whale wallets in roughly seven months.
The supply overhang from that distribution is now sitting somewhere in the market, waiting to be absorbed.
Spot CVD Tells a Different Story
The hourly ETH/USD chart from Coinalyze tells a sharper story than price alone. Aggregated CVD (Cumulative Volume Delta) for spot markets dropped to -120,202K, visible in the chart below the candlestick data. That number reflects the net difference between buying and selling volume on spot exchanges. A reading that deep in negative territory means sellers have been consistently outpacing buyers, not just in derivatives, but in actual spot transactions.
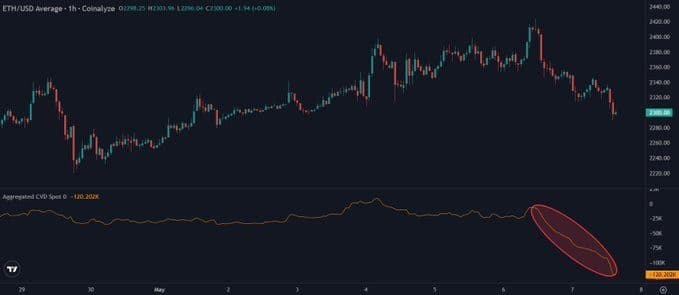
This isn’t leverage-driven panic. It’s real selling.
TedPillows noted on X what that looks like from a trader’s perspective.
“Too much $ETH spot selling happening right now. This doesn’t look good.”
That quote landed alongside the CVD chart circulating in trading circles on May 7.
The VWAP Problem No One Is Talking About
The weekly chart from Binance, shared by TedPillows on X, overlays the anchored VWAP from the 2021 all-time high. ETH has tested that level repeatedly and come back lower each time.
“$ETH keeps getting rejected from 2021 ATH VWAP. Very weak.”
The VWAP line sits around $2,443 on the weekly timeframe. ETH’s current price of roughly $2,334 puts it below that line, again. Every time the price has approached that zone since mid-2025, sellers have stepped in. The pattern spans multiple weeks, visible clearly on the weekly candles going back through 2022 and into the current period.
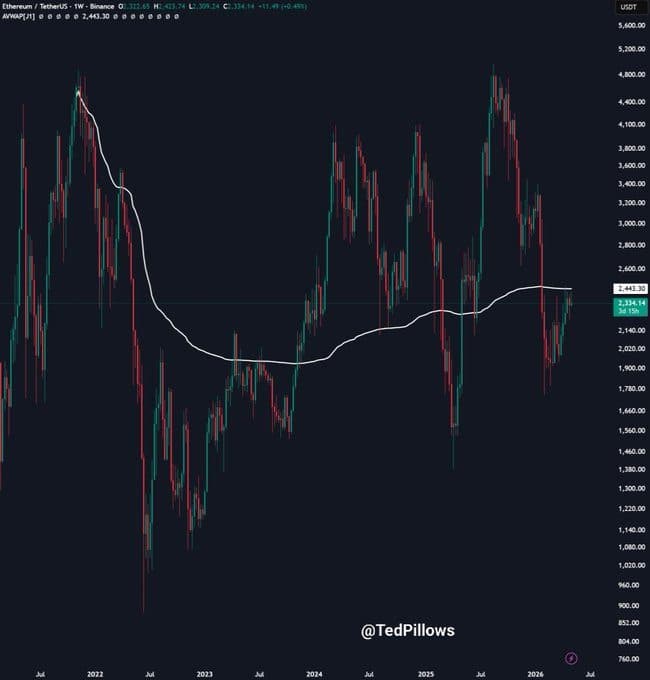
That VWAP level now acts as overhead resistance. Breaking and holding above it would require a demand surge that the current CVD data does not support.
What Gets ETH to $3,000
Alicharts flagged this directly. The road to $3,000 requires either fresh institutional buying or a wave of retail demand large enough to absorb what mid-tier whales have been distributing. Neither has shown up in the data yet.
The CVD reading at -120K is not a minor dip. It printed at the steepest point on the chart visible since late April, circled clearly on the Coinalyze hourly data. Spot buyers would need to reverse that trend before any sustained price recovery gets traction.
Until then, the VWAP rejection holds, the whale distribution continues, and the $3,000 target stays out of reach.