Ethereum has climbed to the top of its established price channel at $2,375, a level that has repeatedly stopped bullish momentum in its tracks. The move brings ETH into one of the most watched technical zones in weeks, with two independent chart analysts flagging the same resistance band from different timeframes.
Trading at roughly $2,367 on the 4-hour chart as of early May, ETH is pressing against a ceiling that has produced sharp reversals before. The next 24 to 48 hours may settle whether this push is the one that finally clears it.
$2,375 Is Not Just a Number
According to alicharts, on X, ETH has reached the top of its channel and this is a level that has historically sent price back down to the lower boundary near $2,210.
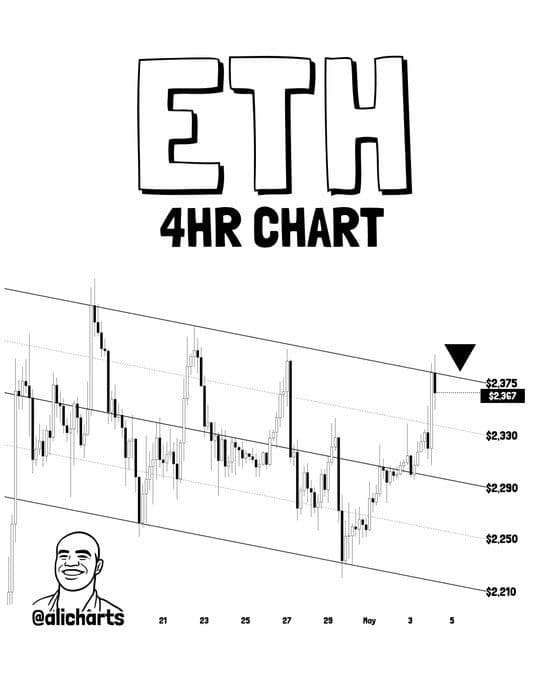
The 4-hour chart he shared shows price tagging $2,375 with a bearish signal directly overhead — a downward arrow sitting above the candle body, indicating a potential distribution zone.
“Ethereum $ETH has reached the top of its channel at $2,375. This is a major area of resistance to watch; in previous instances, this level has triggered a rejection.”
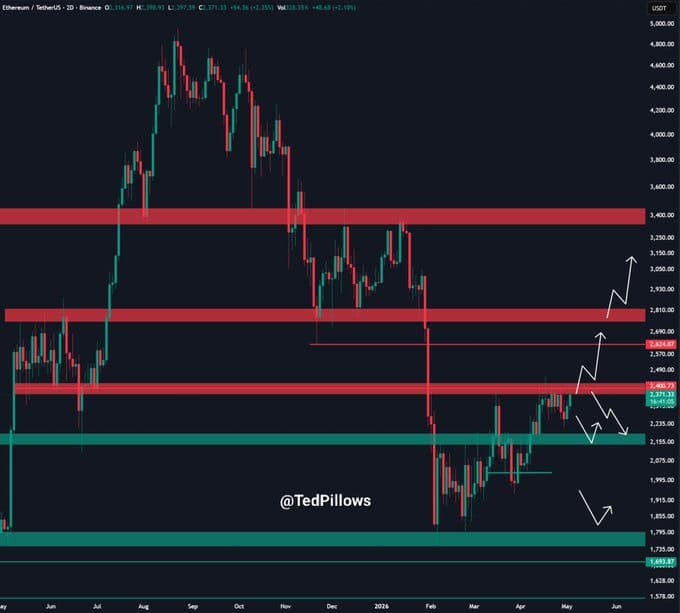
The call is not isolated. TedPillows, on X, looking at the 2-day Binance chart, placed the critical zone slightly higher at $2,400. His chart maps out two scenarios with white arrows — one path bouncing lower before eventually climbing past $2,624 and toward $2,810, and another where a clean rejection sends ETH back below $2,235 and potentially toward the $1,693 support zone.
“ETH tried to break above the $2,400 level but failed. A reclaim above this level could push ETH above the $2,500 zone. A rejection means ETH will drop below the $2,300 level again.”
Two different timeframes. Same conclusion about what matters.
What the Charts Are Actually Saying
The 4-hour channel alicharts mapped runs from roughly $2,210 at the base to $2,375 at the top. ETH has bounced between these two extremes multiple times since mid-April. Each visit to the upper band has so far ended the same way — price gets rejected and tracks back down. The current visit is notable because volume has been relatively thin on the approach, which historically weakens the case for a breakout.
On the 2-day chart from TedPillows, the $2,400 zone sits just above current price and just below a thick red resistance band stretching across the chart. That red zone has not been broken since ETH was trading in the $3,400 range back in late 2025. Getting through $2,400 first is the prerequisite.
If ETH does manage a daily close above $2,375, alicharts puts the immediate upside target at $2,550 — a 7% move from resistance. That level also aligns with the structural high TedPillows identified on his 2-day chart as the first major stop before $2,624.
The $2,210 Floor and What Breaks It
A rejection from current levels sends ETH back toward $2,210 in the near term, per the channel boundary alicharts identified. Below that, TedPillows’ 2-day chart shows support clustered around $2,235 before the next significant floor near $2,075.
A break below $2,300 — the level TedPillows highlighted — would be the first signal that the current rally attempt has failed. The 50-day EMA was sitting near $2,322 as of late April, according to data from CoinDCX, adding another layer of defense just below the $2,375 zone. If that EMA fails to hold, the path toward $2,210 opens quickly.
The coming sessions will clarify which side has more conviction. Right now, ETH is at a crossroads where even a few percentage points in either direction carries real structural meaning.
Disclaimer: This article is for informational purposes only and does not constitute financial or investment advice. Cryptocurrency prices are highly volatile and past performance is not indicative of future results. Always conduct your own research and consult a qualified financial advisor before making any investment decisions.