Ethereum is still in the race, but the chart tells a different story from Bitcoin’s. The ETH price structure entering May sits on a narrow ledge. That ledge has a name: micro support.
According to Morecryptoonline on X, the micro support zone for ETH is defined between $2,256 and $2,325. The account noted the micro structure is less clear than on the Bitcoin chart but added that ETH can still push higher as long as that range holds.
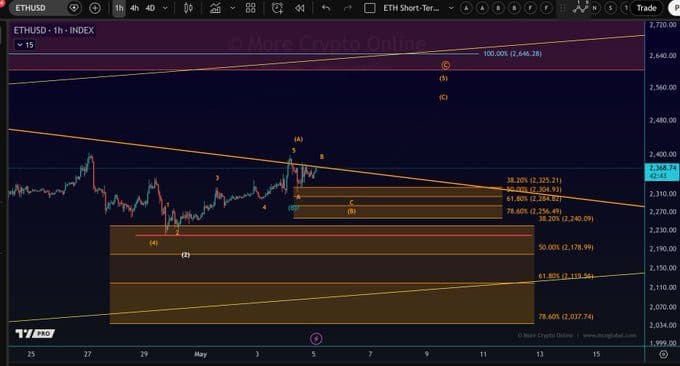
That zone is now the single most watched technical area for Ethereum heading into the next leg of this cycle.
What April’s Numbers Actually Showed
April looked like a recovery for both assets. But dig into the percentages and the structure behind them and the picture splits.
Bitcoin climbed from $68,219 to $76,306, a gain of 11.85%, and briefly tested $79,500. Ethereum moved from $2,103 to $2,256, gaining 7.28%, with a weaker high near $2,466. According to CryptoQuant’s analysis of April’s supply-demand divergence, that was not a broad-based rally. It was Bitcoin-led, and the structural reasons explain why ETH is now trading in a more fragile range.
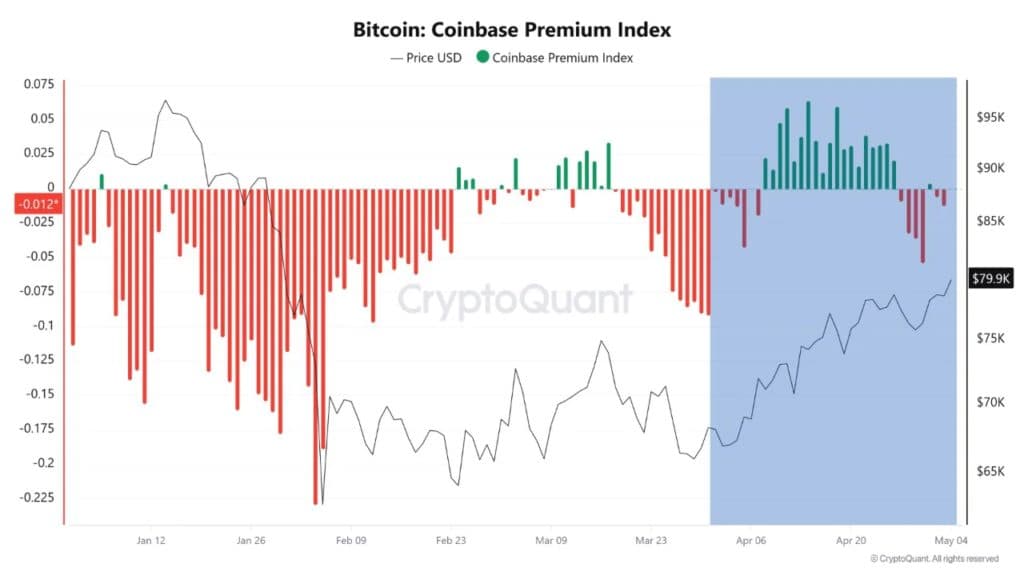
Bitcoin’s Coinbase Premium improved out of negative territory during the period, pointing to renewed U.S. institutional demand. Exchange netflows showed consistent BTC outflows, signaling reduced sell-side pressure alongside ongoing accumulation. Both demand and supply aligned for BTC. ETH had neither of those tailwinds.
ETH Rose Because Selling Stopped, Not Because Buying Started
Ethereum’s Coinbase Premium stayed muted throughout April. Capital allocation favored Bitcoin, not ETH.
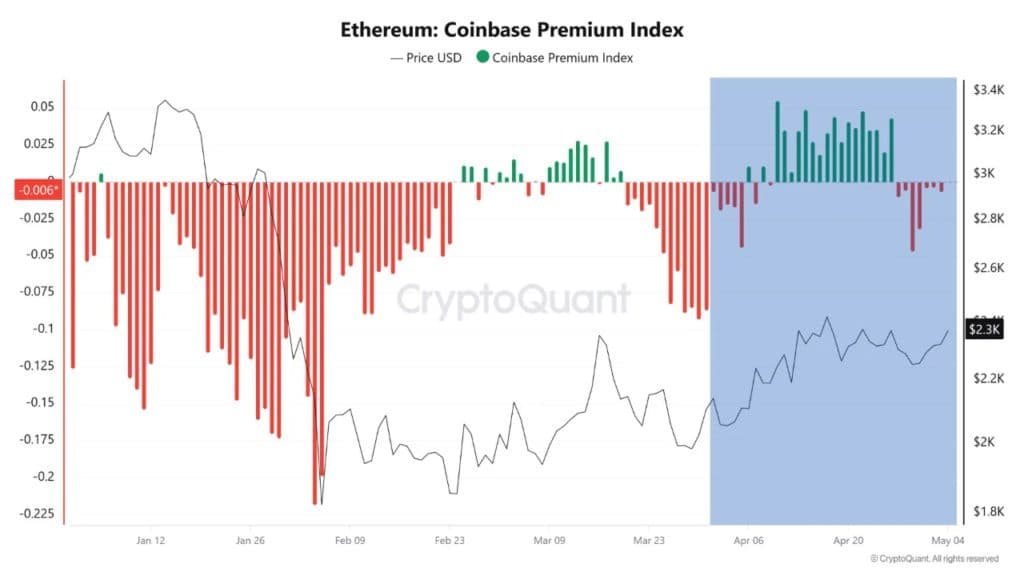
CryptoQuant’s data shows that ETH price action during the month was driven largely by shifts in exchange netflows — meaning supply fluctuations moved the price, not fresh demand.
“BTC was actively bought, while ETH rose mainly because selling pressure eased.”
That distinction is not minor. A supply-driven bounce and a demand-led rally are different animals. One builds structure. The other holds it temporarily, and temporary is the keyword now sitting under $2,325.
The Line That Defines What Happens Next
Morecryptoonline on X framed the current ETH setup plainly. The chart can extend higher, but only while micro support between $2,256 and $2,325 holds. A break below that zone removes the condition.
Bitcoin dominance sits at 60% as of early May 2026, according to CoinDCX market data. The Altcoin Season Index reads 39/100 — firmly in Bitcoin Season territory. These two numbers together describe exactly the environment ETH is navigating. Capital is present in crypto. It is just not flowing toward ETH in the same way.
Ethereum ETFs did record $633.5 million across a 10-day inflow streak between April 9 and April 22, according to SoSoValue data cited by CryptoRank. But ETH ETF products remain roughly $413 million in net outflows year-to-date. One streak does not reverse a structural deficit.
Capital Is Getting Selective
CryptoQuant described April not as a full market recovery but as the beginning of capital rotation. The language matters. Rotation implies selection. Some assets get bought. Others wait.
BTC ETFs posted $2.1 billion in inflows across nine days from April 14 to April 24, the largest stretch since October 2025, per CoinGlass. Bitcoin attracted institutional capital back at scale. ETH’s ETF products got a brief window but have not matched that depth.
If Ethereum begins to show sustained spot demand similar to what BTC showed in April, broader altcoin participation could follow. CryptoQuant’s analysis puts that condition clearly — until that happens, Bitcoin dominance is expected to hold. April was a starting point, not a conclusion.
Micro support between $2,256 and $2,325 is the first test. Structure either holds or it doesn’t.
Disclaimer: This article is for informational purposes only and does not constitute financial or investment advice. Cryptocurrency prices are highly volatile. Always conduct your own research before making any investment decisions.