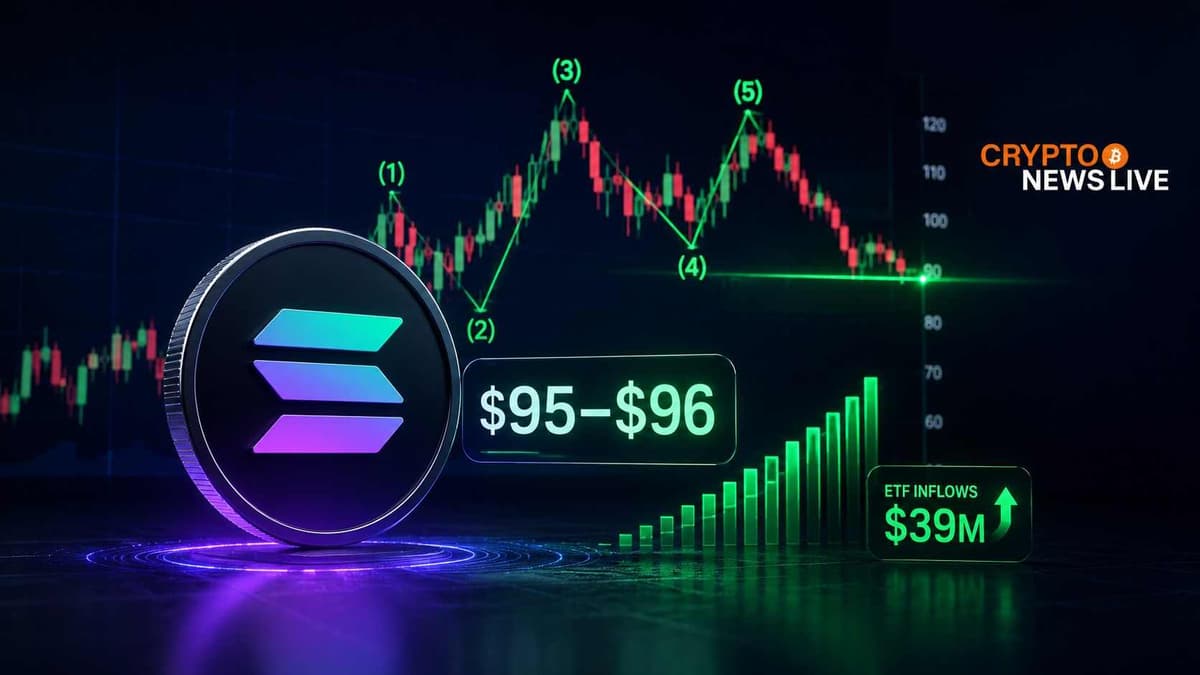
Solana price analysis on May 11, 2026 puts SOL exactly where one technical read said it would land. The token reached the $95–$96 area on the hourly chart, tagging a zone that an Elliott Wave count had flagged as the next key level to watch following the prior leg up.
The move was not quiet. SOL gained over 11% across the past seven days, with a 24-hour high of $96.78 recorded on May 11 and a low of $93.29 in the same session. Trading volume held above $4.5 billion for the day.
The Wave Count and What It Says
According to More Crypto Online on X, the price action is tracking a planned structure.
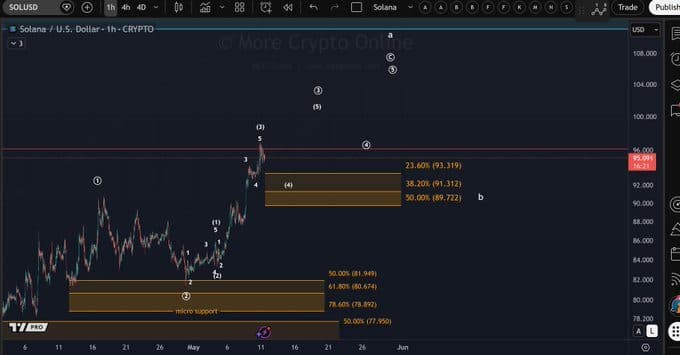
“Solana is following the plan. The price has reached the $95–$96 area now. Micro support to keep the upside momentum intact is defined between $89.72 and $93.32,” More Crypto Online posted on X.
The attached chart maps an hourly Elliott Wave impulse with waves one through three complete. Wave four, the current corrective phase, has been pulling back into the Fibonacci retracement zone. Three levels define the micro support band: 23.6% at $93.32, 38.2% at $91.31, and 50% at $89.72.
Those three levels are not arbitrary. In Elliott Wave theory, wave four corrections typically find their floor somewhere within the 23.6% to 50% retracement of the prior wave three move. A hold inside this band keeps the count valid and sets up wave five.
Where Wave Five Could Go
The chart from More Crypto Online projects wave five targets extending toward $100 and beyond, with annotations pointing to a continuation of the broader upward structure. No fixed price target was specified for that leg, but the directional bias is clear from the count.
Source:More Crypto Online
A break below $89.72 does not end the bullish structure outright. It pushes SOL into a deeper retracement zone, where the 61.8% and 78.6% levels sit between $87 and $84. That band is labeled as a secondary support zone on the chart, though entering wave five from that depth would require a larger recovery move before any new high attempt.
The Institutional Signal Running Alongside
What makes the current technical setup harder to dismiss is what is happening off the chart. Solana spot ETFs recorded $39.22 million in net inflows over the past seven days. That is demand coming in through a separate channel from spot trading, and it builds a demand floor that pure price action alone does not show.
On the same day SOL tested the $95–$96 zone, Solana’s core developer team confirmed the Alpenglow consensus upgrade went live on a community test cluster. Described as the most significant protocol change in Solana’s history, the timing sits directly on top of this technical breakout attempt. Most price coverage on May 11 treated the two events separately. They are not separate for anyone watching the asset from both sides.
The Level That Changes the Picture
$89.72 is the number. A weekly close below that level pushes wave four past the 50% retracement and into territory that technically strains the current count. The bullish read survives, but it gets messier.
Above the current price, $96.85 was the session high on May 11. Resistance clusters above that at $98. A clean close above $98 with volume behind it would be the confirmation that wave five has started.
Solana holds a market cap of $55.38 billion as of May 11, 2026. The circulating supply sits at 580 million SOL. For anyone watching this from an emerging market context, where SOL has gained significant traction as a lower-fee alternative to Ethereum for on-chain activity, the $89.72–$93.32 range is the floor to track in the sessions ahead.
Disclaimer: This article is for informational purposes only and does not constitute financial or investment advice. Cryptocurrency prices are highly volatile. Always conduct your own research before making any investment decisions.