Bittensor’s TAO token ran into resistance this week. Price climbed to a local high before stalling inside a zone that technical watchers had been tracking, and the decline since then carries the structure of a correction rather than a full reversal.
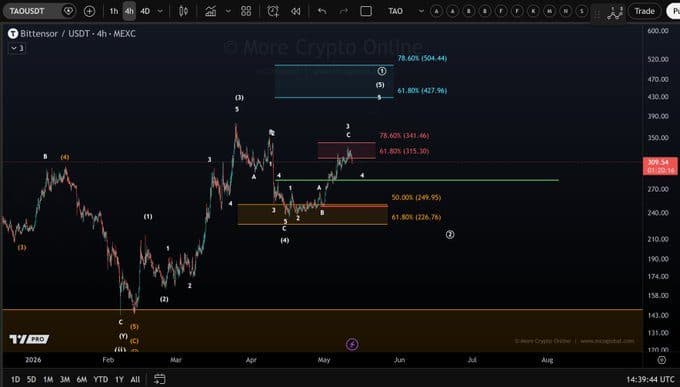
TAO was trading near $309 at the time of writing on the MEXC 4-hour chart, pulling back from the week’s high after touching the first significant resistance region. That move into resistance is what triggered the current retreat.
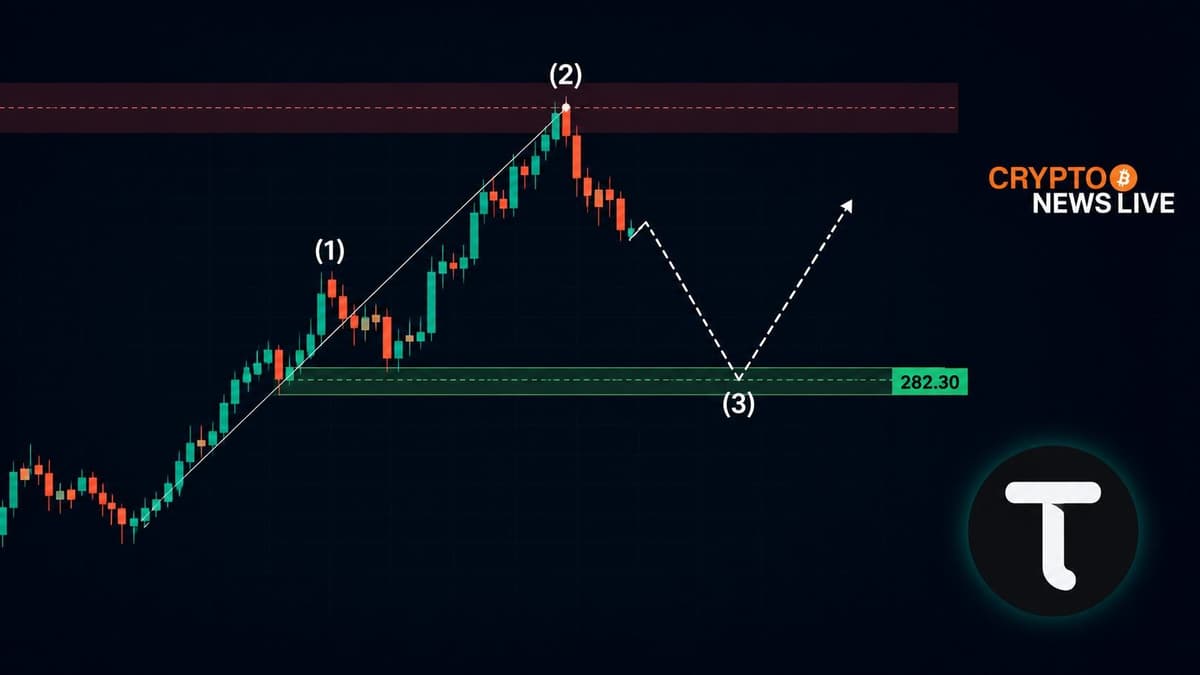
Wave Structure Points Lower Before Higher
According to More Crypto Online on X, the pullback off the weekly high looks like a 3-wave corrective structure. In Elliott Wave terms, that type of move typically resolves back in the direction of the prior trend once it completes, not against it.
“TAO has now reached the first important resistance zone, so the current pullback is not particularly surprising,” More Crypto Online posted on X, noting the decline from the week’s high currently shows a 3-wave structure.
The 4-hour chart on MEXC maps Fibonacci levels that give exact price references. Near-term retracement zones sit at $315.30 and $341.46, both of which price approached before turning back. The broader upside extensions on the same chart mark $427.96 and $504.44 as targets for a subsequent leg higher, if and when the correction finishes.
Those higher targets are not in play right now. What is in play is where this pullback finds its floor.
$282.30 Is the Number to Watch
More Crypto Online identified $282.30 as the next meaningful support level. That price represents the green structural support zone visible on the 4-hour chart, a region where prior buying absorbed selling pressure.
“The next important support level is around $282.30, which represents the green structural support zone,” More Crypto Online noted on X.
A hold at that level keeps the broader bullish structure intact. Price finding buyers there would be consistent with the 3-wave corrective read, setting up a potential continuation higher toward those Fibonacci extensions.
Break Below $282 Changes the Picture
What happens if $282.30 breaks is a different conversation entirely.
“If the market breaks below that level, focus would shift back toward the April lows as the next larger support region,” More Crypto Online wrote on X.
The April lows sit considerably below current price. A move back to that region would represent a significantly larger drawdown and would call the current bullish structure into question. That outcome is not the base case in the current read, but the level makes it the clearest line between two very different scenarios.
Local Top Signal at Resistance
The chart structure as of now suggests a local top may already be in place. Price reached the first key resistance zone, failed to break through with conviction, and has since declined in a corrective pattern.
“At the moment, at least a local top appears to be forming,” More Crypto Online posted on X.
TAO’s all-time high stands at $760.18, reached in April 2024, placing current price roughly 59% below that peak. The resistance zones on the way up carry weight precisely because of that gap. Each one represents a level where previous buyers are sitting at a loss and may look to exit on strength.
The short-term picture is straightforward. TAO has corrected from resistance in a 3-wave structure. The $282.30 zone is the first real test. Price behavior at that level will determine whether this week’s rally was a pause in a larger move or a setup that needs more time before the next leg begins.
Disclaimer: This article is for informational purposes only and does not constitute financial or investment advice. Cryptocurrency prices are highly volatile. Always conduct your own research before making any investment decisions.