XRP keeps playing games. The token spiked above its descending resistance line over the weekend, gave bulls exactly the confirmation they wanted, then pulled back below it within hours. That is now a recurring pattern inside a symmetrical triangle that has been compressing price since February 2026.
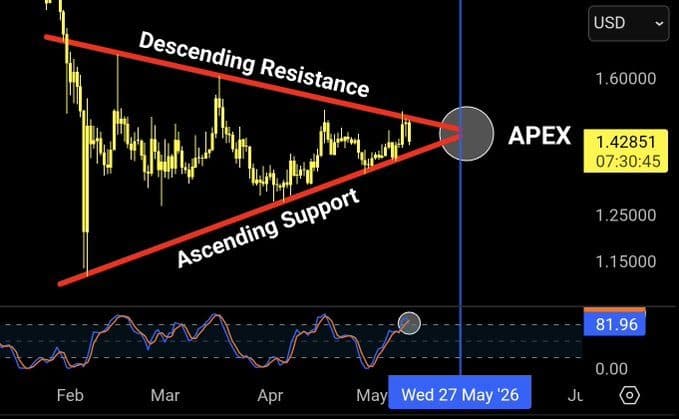
The daily chart shows it plainly. Descending resistance runs from the $1.60 highs in February down through each successive rejection. Ascending support rises from the lows. Both trendlines converge at an apex that, per the chart, arrives around late May 2026. Price at the time of writing sits near $1.42851.
Weekend Rejection Sends XRP Back Into Range
ChartNerdTA, a technical analyst on X, posted Monday that the oscillation was still firmly in play.
“$XRP Update: The squeeze continues. Price is now back within the oscillation range after weekend rejection on resistance. The daily stoch RSI has printed a bearish cross in overbought territory. Compression will not last indefinitely.”
That bearish cross on the Stochastic RSI is worth unpacking. The indicator had climbed into overbought territory as the weekend spike pushed above resistance. A bearish cross there does not automatically mean price drops — but it does suggest upward momentum is fading before any clean breakout was confirmed.
The Stochastic RSI reading on the chart sits at 81.96 on the daily timeframe, still elevated. Historically, readings above 80 combined with a bearish cross signal that buyers are losing grip of short-term momentum.
The Same Fake-Out, Playing Out Again
This is not the first time XRP has teased a resistance break and retreated. ChartNerdTA flagged the identical dynamic in an earlier post on X.
“$XRP continues to toy with us during this oscillation. Yesterday, the price spiked above resistance. Today, we are back in range. The daily Stoch RSI is now overbought, and the volume remains relatively low. If the move to $1.60/$1.80 unfolds, friendly reminder: be cautious.”
Low volume on the weekend spike matters. A breakout without volume expansion is what technical traders call a trap. The price moves through a level but nobody backs it up with real buying pressure, so it collapses back. That is precisely what happened here.
The compression itself has been building since early February 2026 when price peaked near $1.60 and sold off hard. Each subsequent rally set a lower high. Each pullback set a higher low. That mechanical tightening is what a symmetrical triangle does — it delays the decision without resolving it.
What the Chart Is Actually Saying
The uploaded chart makes the structure clear. Descending resistance presses down from the upper left. Ascending support rises from the lower left. They meet at the APEX label on the right side of the chart, sitting around the $1.42 level with the timestamp showing Wednesday, 27 May 2026 as the approximate convergence zone.
That gives less than three weeks before the pattern forces a decision by geometry alone. Price cannot stay inside the triangle indefinitely.
The bullish case requires a confirmed daily close above the descending resistance, somewhere in the $1.48 to $1.52 range, backed by meaningful volume expansion. If that holds, the measured move from the triangle’s height projects toward the $1.60 to $1.80 range ChartNerdTA mentioned.
The bearish case plays out on a close below ascending support near $1.30. That opens a drop toward the $1.20 zone.
Neither scenario is confirmed right now. The Stochastic RSI bearish cross adds a layer of near-term caution. Volume staying low keeps both outcomes equally possible.
Apex Pressure Builds as Days Shrink
One detail almost every other coverage of this pattern misses: XRP has now rejected at resistance twice inside this oscillation without printing a clean daily close above it. That is not the same as the pattern staying neutral. Each failed attempt burns buyer momentum and gives the bearish case more structural support.
ChartNerdTA noted that compression will not last indefinitely. That much is mathematically true. A symmetrical triangle at its apex leaves almost no room. Price either breaks clean or gets squeezed out.
The Stochastic RSI reading at 81.96 sitting in overbought territory with a bearish cross now confirmed means any upside attempt in the next few sessions needs volume behind it. Without that, the oscillation continues, the apex narrows further, and the breakout — when it finally comes — will have very little runway to build on before the geometry forces resolution.
Disclaimer: This article is for informational purposes only and does not constitute financial or investment advice. Cryptocurrency trading carries significant risk. Always conduct your own research before making any trading or investment decisions.