XRP has spent most of April 2026 pressing against a ceiling it hasn’t cleanly broken. The coin is trading near $1.40 as of early May, stuck below its 200-day moving average at $1.42, and short sellers have been piling in. That positioning is now becoming a risk.
According to @CW8900, on X, XRP has started to shift in a way that puts short positions under pressure.
“XRP has started to move to liquidate the remaining short positions. Most short positions will be liquidated if it rises just to $1.5.”
That $1.50 level isn’t arbitrary. It matches where the CoinAnk 3-day liquidation heatmap, sourced from CoinGlass, shows the heaviest concentration of short exposure stacked just above current price.
What the Heatmap Is Saying
The 30-day CoinAnk chart attached here tells a clear story. After XRP surged from around $1.25 in early April to a local peak just above $1.50, a thick band of yellow and orange liquidation zones formed between $1.40 and $1.55. Price has since pulled back and is now hovering directly beneath that cluster.
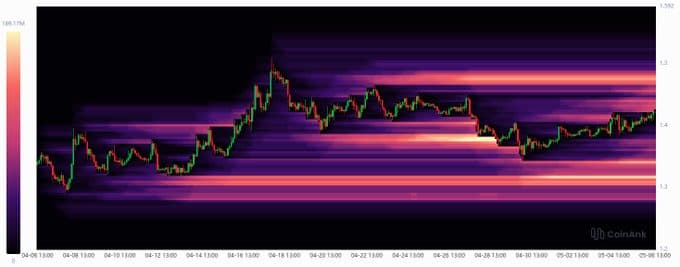
The horizontal bands on the chart aren’t just visual. Each one represents a zone where leveraged short positions are stacked, and any price move into those zones triggers automatic closures. That buying from forced closures pushes price higher, pulling in the next cluster above it. It’s a chain reaction once it starts.
CoinGlass data as of May 6 puts XRP open interest at $2.61 billion. Futures volume in the past 24 hours hit $3.3 billion, well above spot volume of $364 million. That ratio shows the derivatives side is driving price action right now, not organic spot buying.
The $1.50 Trigger and What Follows
XRP’s 14-day RSI sat at 41.26 as of May 4, according to CoinDCX. That’s neutral but tilted slightly bearish. A push back toward $1.43 to $1.46, which the coin has tested four times this year without a weekly close above it, would already begin touching the lower end of the short liquidation cluster.
A clean weekly close above $1.46 is what traders need to watch. That’s the threshold where forced short closures start to layer on top of each other. The $1.50 level is where @CW8900 says the bulk of them sit.
The last time XRP leverage ratios on Binance dropped to near 0.1, as tracked by X account @XrpUdate on May 2, the setup resolved violently to the upside. Between late June and mid-July 2025, XRP ran from $1.96 to $3.65 as the leverage ratio climbed from below 0.3 to just under 0.6 over four weeks. That was a different price range, but the structure was similar: low leverage, price holding above key support, shorts exposed.
Thin Liquidity Makes the Move Faster
Binance’s 30-day Liquidity Index for XRP has dropped close to zero, according to AMBCrypto. Turnover collapsed from over $200 billion in January 2025 to near zero. A thinner order book doesn’t stop moves. It makes them faster and harder to exit.
When the heatmap’s yellow zones above $1.40 get touched, there’s less depth to absorb the buying pressure from closed shorts. That’s what turned a 2023 short squeeze in XRP from a 10% move into a near-doubling within days, from under $0.50 to close to $1.20, according to historical data.
Open interest rising while funding rates stay negative, a setup AMBCrypto confirmed was in play earlier this year, shows traders are still betting on more downside while price holds. That combination doesn’t last forever. Either the shorts are right and XRP breaks below $1.30, or price climbs and they get washed out at $1.50.
The heatmap says the latter scenario has more fuel loaded into it.
Disclaimer: This article is for informational purposes only and does not constitute financial or investment advice. Cryptocurrency trading carries significant risk. Always conduct your own research before making any trading decisions.