XRP is moving sideways. Bitcoin has already put in stronger B-wave rallies, but XRP has not followed. The higher timeframe structure has not shifted in any meaningful way.
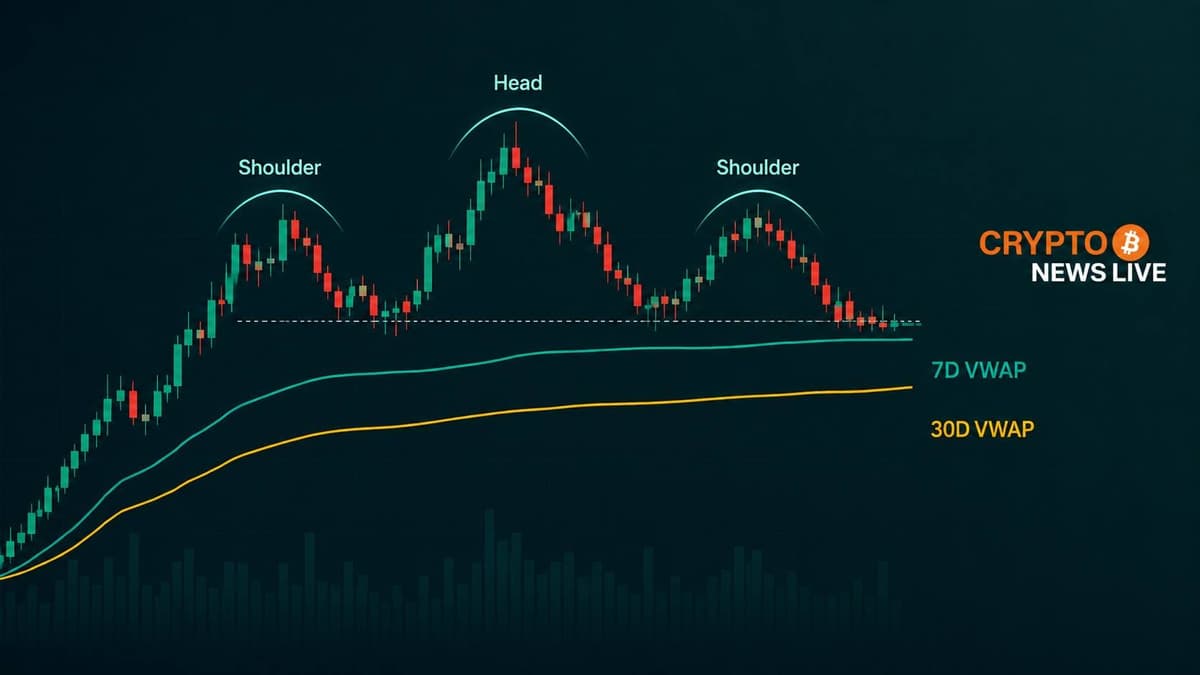
The token continues to trade inside what technical analyst Morecryptoonl described on X as a corrective ABC structure. The current move looks more like a B-wave range build than any kind of impulsive advance.
Orange Zone Still the Deciding Level
The $1.22 to $1.55 range remains the central battleground. As long as XRP stays trapped inside it, the structure reads corrective. According to Morecryptoonl on X, this orange range is the key local support and resistance region, and nothing structurally changes until price escapes it with conviction.
That’s the problem for bulls right now. XRP is not showing the kind of aggressive upside momentum you’d expect from an asset entering an impulsive advance. If it were already in one, Morecryptoonl noted on X, the market would likely be pushing far more aggressively to the upside by now.
The weekly chart attached to the analysis shows the current price near $1.38, sitting just above the 50% retracement at $1.21858 and well below the 61.8% Fibonacci level at $1.78667.

The red resistance zone extends from roughly $1.78 up to $2.87. A temporary rally into that region cannot be fully dismissed, but it would still sit inside a larger B-wave corrective frame.
Gaussian Channel Adds a Critical Layer
There’s something the broader coverage keeps skipping. ChartNerdTA posted on X a monthly chart showing XRP has only ever put in a major bottom when price touches the lower regression band of the Gaussian Channel.
That lower band has not been tested yet during this correction. Not once.
Every major cycle low going back to 2014 on the chart shows a “bull switch” event, where price hits the lower Gaussian band and reverses. That event has happened three times historically. The current correction has not produced that touch. ChartNerdTA noted on X this creates confluence with CK’s Monthly Ribbons, another longer-term momentum tool still yet to confirm a bottom signal.

What that means structurally: the correction may not be finished. The price has not visited the technical zone where XRP has historically found major demand.
C-Wave Target Zone Between $0.98 and $0.48
The weekly Elliott Wave picture carries a risk scenario that most short-term traders are not watching. Morecryptoonl outlined on X that from the higher timeframe, there is currently no strong evidence XRP is beginning a direct impulsive move toward new all-time highs.
The structure still allows for another C-wave decline. The target support region sits between approximately $0.98 and $0.48. That’s the larger corrective landing zone if the B-wave exhausts and price rolls over.
The weekly chart shows the C-wave box drawn across 2026 into 2027, with the 61.8% Fibonacci retracement at $0.73666 and the 78.6% level at $0.48648 sitting inside that zone. Neither level has been visited during this cycle.
Bitcoin’s proximity to major resistance is part of the equation too. While BTC sits near its own overhead resistance, XRP is unlikely to break out independently. Morecryptoonl’s view on X is that caution remains warranted as long as both conditions hold.
What Bulls Need to See
A temporary B-wave rally into the $1.78 to $2.87 red resistance zone is still structurally possible. The Fibonacci levels within that box include the 38.2% retracement at $1.78667, the 50% level at $2.05258, the 61.8% at $2.35807, and the 78.6% extension near $2.87305.
But hitting that zone doesn’t confirm a bull trend. It would still fit comfortably within a corrective B-wave before another leg down.
The real confirmation bulls need is a breakout above that red zone entirely, paired with momentum that looks nothing like the current sideways chop. Without that, the Gaussian Channel data from ChartNerdTA and the Elliott Wave count from Morecryptoonl are both pointing at the same conclusion.
XRP has not bottomed yet on any of its historically reliable indicators.