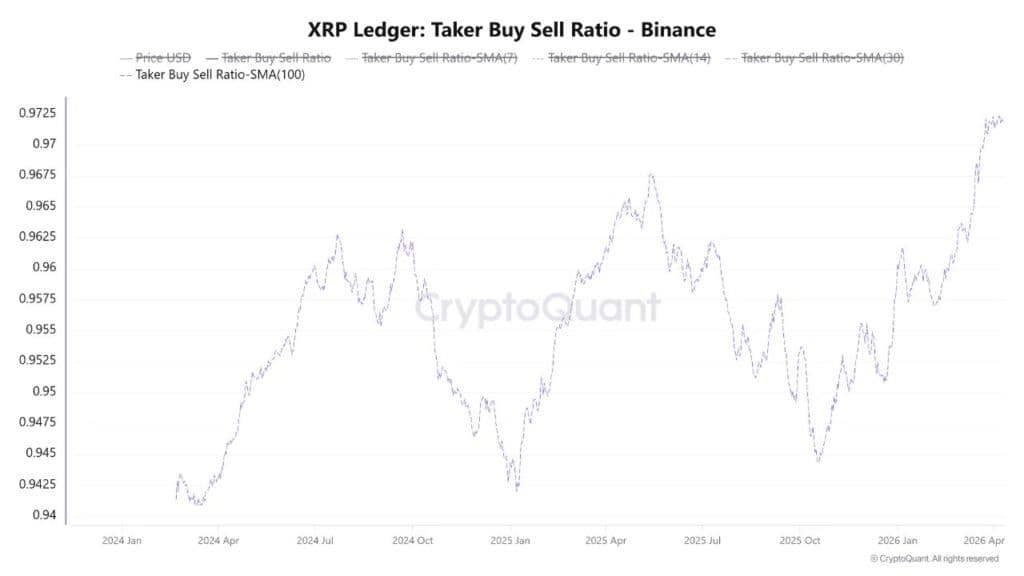
XRP’s order flow data on Binance is flashing a signal not seen before. The 100-day Simple Moving Average of the Taker Buy/Sell Ratio has hit a record high, according to CryptoQuant analysis published this week. Two forces drove it there at the same time.
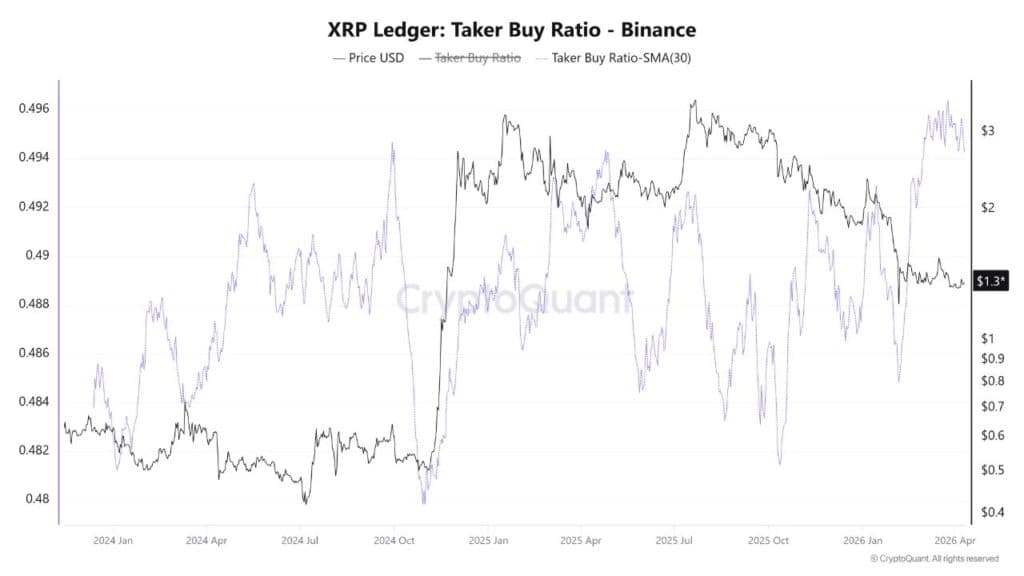
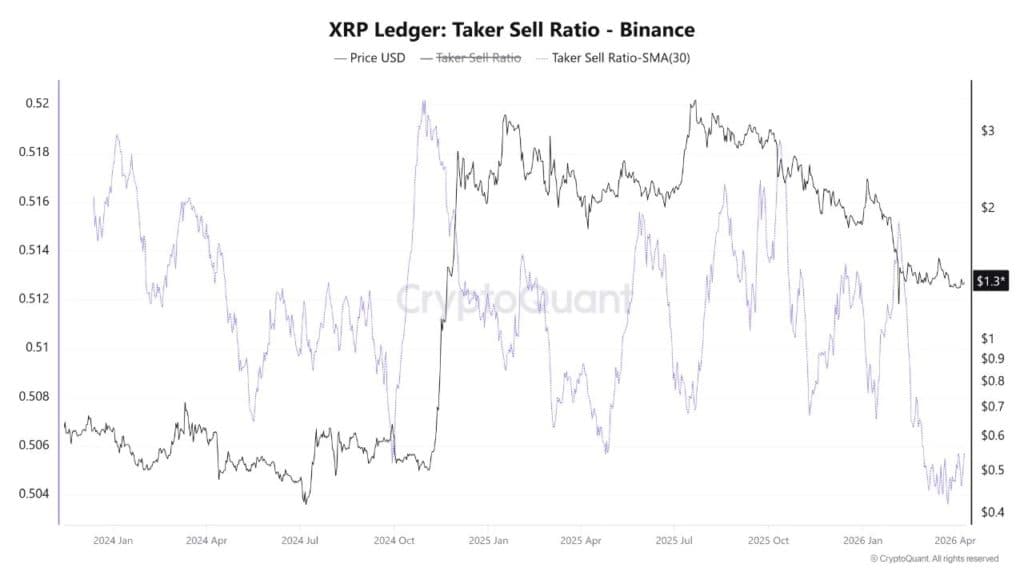
The 30-day SMA of the buy ratio peaked at roughly 0.495. The 30-day SMA of the sell ratio dropped to a cyclical low around 0.505. Both moved in opposite directions simultaneously, compressing a gap that has historically stayed wide during bearish cycles.
Sellers Losing Ground on the Order Book
Taker metrics track who is initiating trades. When taker buy volume rises, buyers are hitting ask orders, not waiting for sellers to come to them. That shift in aggression matters because it shows conviction, not patience.
The sell ratio decline tells a parallel story. Sellers are placing fewer market orders. The ones that do sell aren’t finding enough pressure to push price down. CryptoQuant’s data on the full XRP taker ratio chart shows this divergence running across a sustained window, not a one-day spike. That detail separates it from short-term noise.
The gap between buy and sell SMAs is now at its narrowest point in the dataset. When that gap closes from the sell side dropping and the buy side rising together, it signals that bears are running out of firepower. Not that bulls are winning yet, but that resistance is fading.
What the 100-Day SMA Record Actually Means
A single-day ratio spike can be noise. A 100-day SMA record is harder to dismiss.
That moving average absorbs daily volatility and reflects sustained directional change over months. Reaching a historic high on that timeframe means buyers have been consistently more aggressive than sellers for an extended stretch. Not in one session. Across the full window.
“XRP taker buy/sell ratio just hit an ALL-TIME HIGH on Binance. Sellers are exhausted. Buyers are getting aggressive. Smart money is quietly loading bags the accumulation phase is REAL and the data doesn’t lie,” a CryptoQuant contributor wrote on X.
The CryptoQuant analysis describes this as a structural shift, pointing to systematic accumulation rather than speculative short-term buying. Buyers are absorbing liquidity consistently. Ask orders are being filled. The sell side isn’t keeping pace.
The Numbers Behind the Shift
Buy ratio SMA sitting near 0.495 and sell ratio near 0.505 might look close to neutral. But the direction matters more than the level. Six months ago that spread was wider. The trajectory since has been one-sided.
CryptoQuant’s framework for reading this data connects to order flow analysis broadly. Takers, by definition, accept the current price. When takers are predominantly buying, that means the people most willing to pay market price are bullish. Sellers waiting on limit orders are getting picked off. That dynamic, sustained over 100 days, is what the SMA captures.
For XRP holders watching price stall while on-chain data strengthens, this is the data point that changes the read. Price can lag order flow. The structure often builds before the move. What the taker data shows right now is that structure forming at a depth not recorded before on Binance for this asset.
The CryptoQuant contributor’s post framed it simply. Sellers exhausted. Buyers aggressive. Accumulation confirmed by data, not by price alone.