The XRP TD Sequential buy signal on the 4-hour chart is active again. Crypto analyst @alicharts flagged the reversal signal on X, with XRP sitting at $1.382 after sliding more than 5% from its recent peak.
The setup follows a textbook nine-red-candle sequence on the 4-hour timeframe. That sequence marks trend exhaustion according to the Tom Demark indicator. Nine consecutive bearish candles printed from the $1.46 area downward, bottoming at $1.382 before the signal triggered.
The Sell Signal That Made This One Credible
What separates this particular signal from noise is what came before it. On May 6, the same indicator on the same timeframe flashed a sell signal right at the $1.46 high. That call held. XRP dropped 5.5% over the 48 hours that followed, landing near current price levels.
According to @alicharts on X, “On May 6, I noted the indicator flashed a sell signal at the $1.46 high. That call perfectly timed the local top, leading to the 5.5% correction we’ve seen over the last 48 hours.”
That context matters. The sell signal and buy signal together form a paired technical setup. The indicator called the top, tracked the move down, and now signals exhaustion of that same decline.
The chart shared by alicharts on X shows the “9” label printed at the bottom candle, positioned right at $1.382. That is the visual confirmation of the TD Sequential setup completing after the red candle sequence finished building from May 7 through May 8. Price had steadily declined from $1.46, stepping down through $1.44, $1.42, $1.40, before stalling near $1.382 where the count ended.
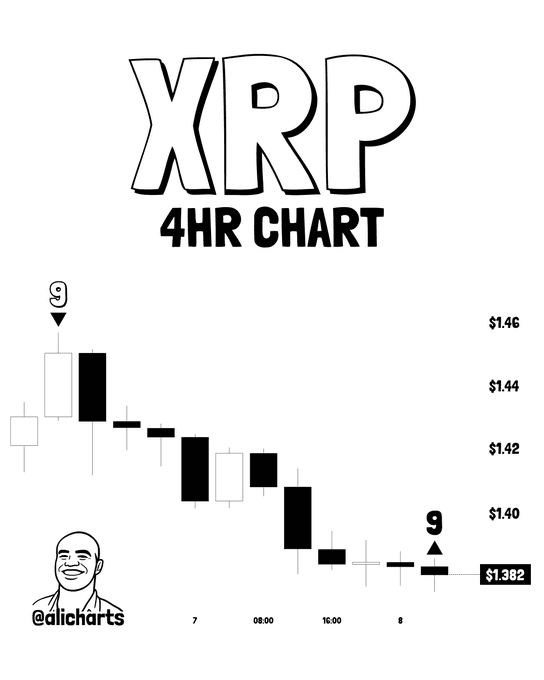
What the $1.382 Level Signals on the Chart
The signal at $1.382 is not a support level call. It is a count completion. The TD Sequential does not predict how far price will go. It signals that the current trend has run its course and conditions for a reversal are in place.
XRP traders watching the 4-hour close will look for a candle that holds above the signal candle’s low. That would confirm the bounce is real.
As @alicharts posted on X, “To me, this suggests the local exhaustion is over, and XRP is ready to rebound.”
Short-term targets from the same analysis sit at $1.45. That is the prior resistance level and the same price where the May 6 sell signal triggered. Beyond that, the secondary target is $1.80, which would require clearing meaningful overhead supply.
Two Targets, One Condition
Getting to $1.80 is not automatic. The $1.45 resistance zone has to give way first. That level rejected XRP twice in recent sessions and now sits as the first line of overhead supply.
Price at the time of writing sits around $1.39, down roughly 1.5% in the past 24 hours. The 4-hour candle close will determine whether the bounce gains traction or fades. Volume on the rebound candles will be the secondary filter.
@alicharts stated on X: “I’m looking for a move back toward the $1.45 resistance, with a secondary target of $1.80 once we clear the overhead supply.”
The TD Sequential has a track record of accuracy on XRP’s 4-hour chart specifically. It does not work every time. But the back-to-back sell and buy signals on the same timeframe, within the same price structure, give this particular setup more context than a standalone signal would carry.
XRP holders watching this chart face a straightforward read: either the bounce confirms at the 4-hour close, or the $1.382 low breaks and the count resets.
Disclaimer: This article is for informational purposes only and does not constitute financial or investment advice. Cryptocurrency trading carries significant risk. Always conduct your own research before making any investment decisions.